Livestock & Fibonacci
The charts are key to this analysis.
There are two methods we use at ONE44 to find support and resistance in the markets.
The first are major Gann squares, these are the yellow horizontal lines on the chart.
The second is Fibonacci retracements.
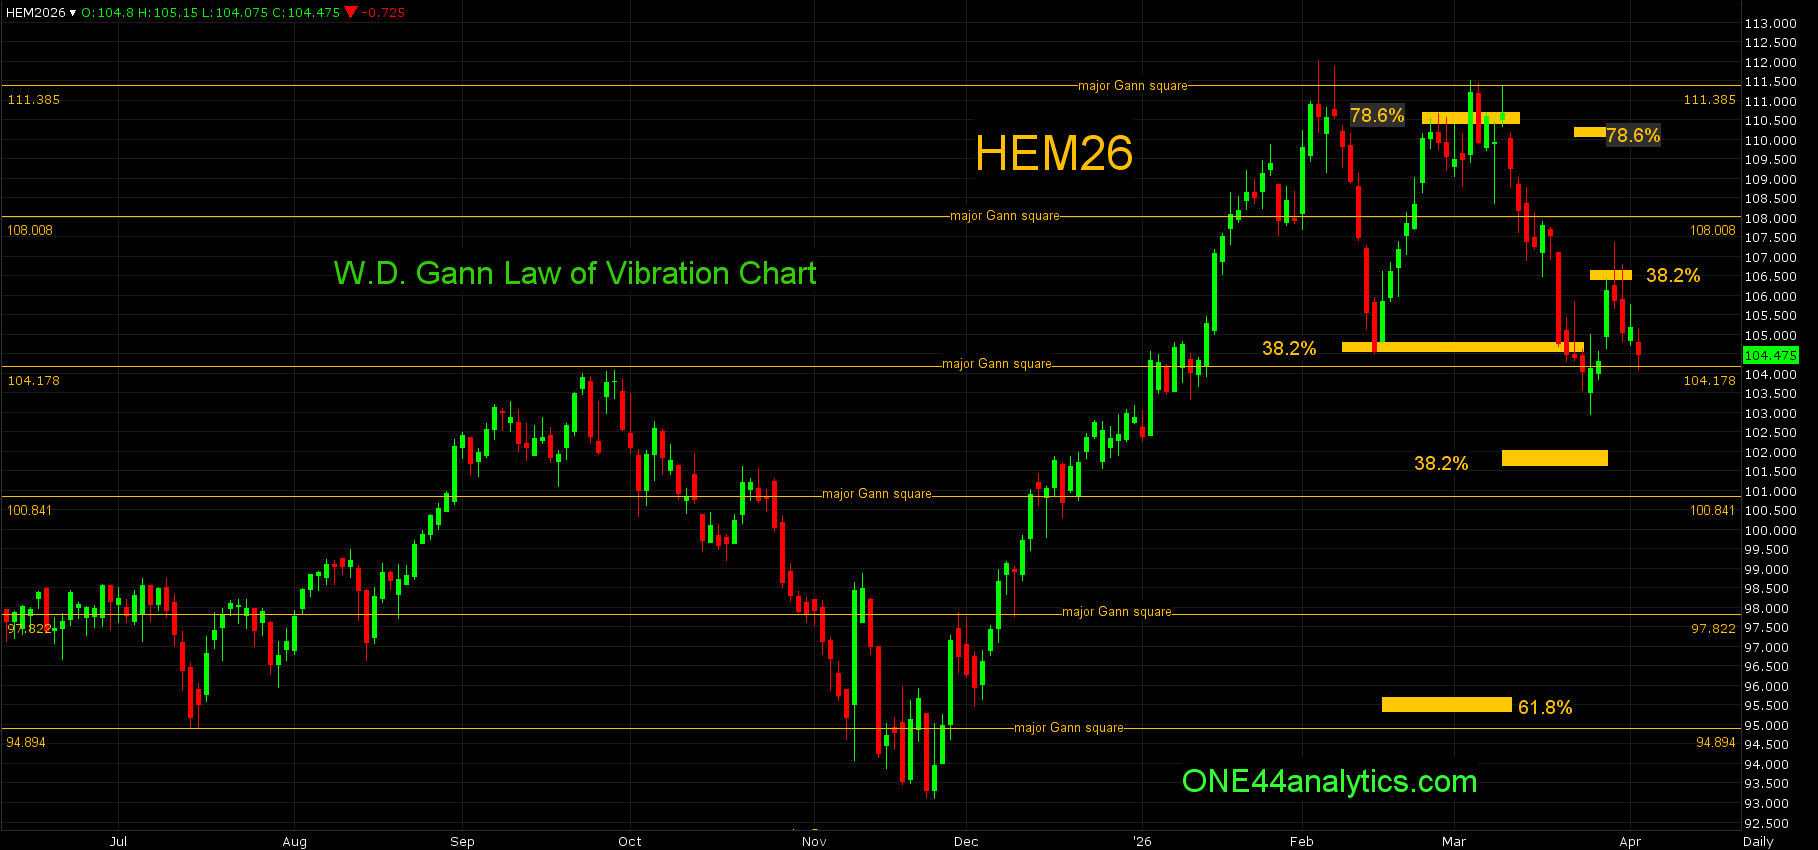
(HEM26)
Looking back on the last two months in June Hogs you can see the high hit the 111.38 major Gann square on 2/4/26, the setback from it hit 38.2% of the 11/24/25 low and 2/4/26 high at 104.80 on 2/13/26. Holding a 38.2% Fibonacci retracement keeps the trend positive and it should go for a new high, however we watch all the retracements on every move to see just how strong, or weak the market is regardless of the longer term target.
Between 2/25/26 and 3/10/26 the market failed to make a new high in the area of a 78.6% retracement, when following the ONE44 78.6% rule we know,
Any market that hits 78.6% should go 78.6% back the other way. This is also where a lot of Bull markets end and start.
It did have one close above 78.6% at 110.70, but as always it needs two in a row to violate the level. The break from there sent it down two major Gann squares at 104.17. The rally from that hit 38.2% back to the contract high at 106.40 on 3/30/26, failing to get above this level keeps the short term trend negative and we will now watch for the long term swing point on the continuation chart at 102.00, this is the level that needs to hold to keep the long term trend positive.
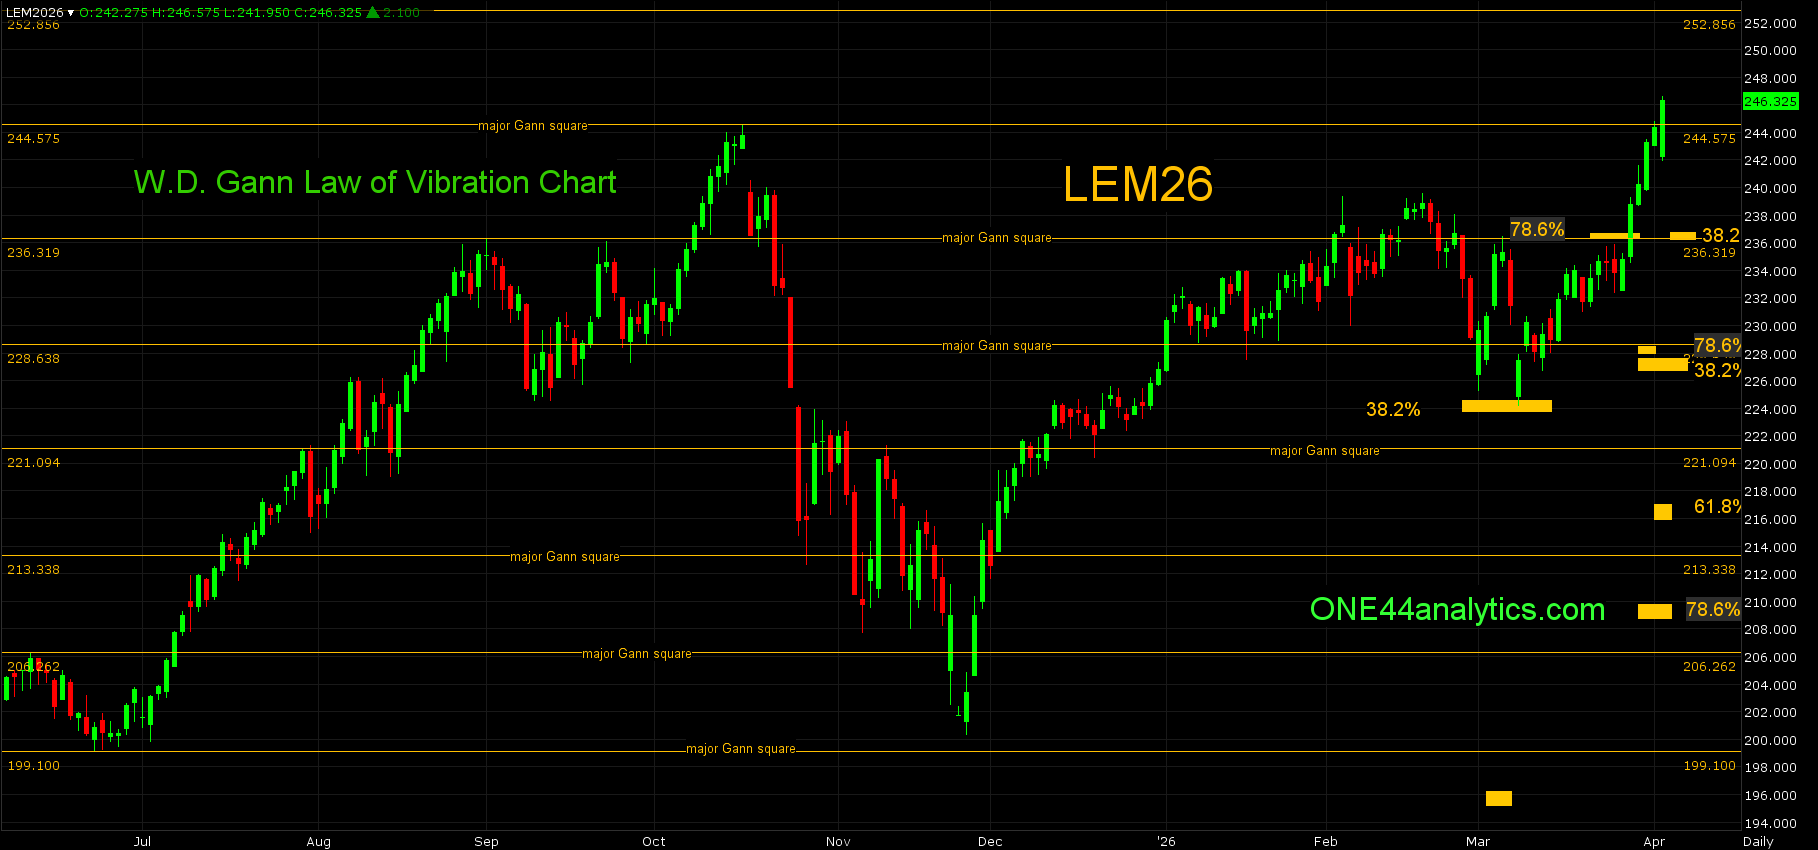
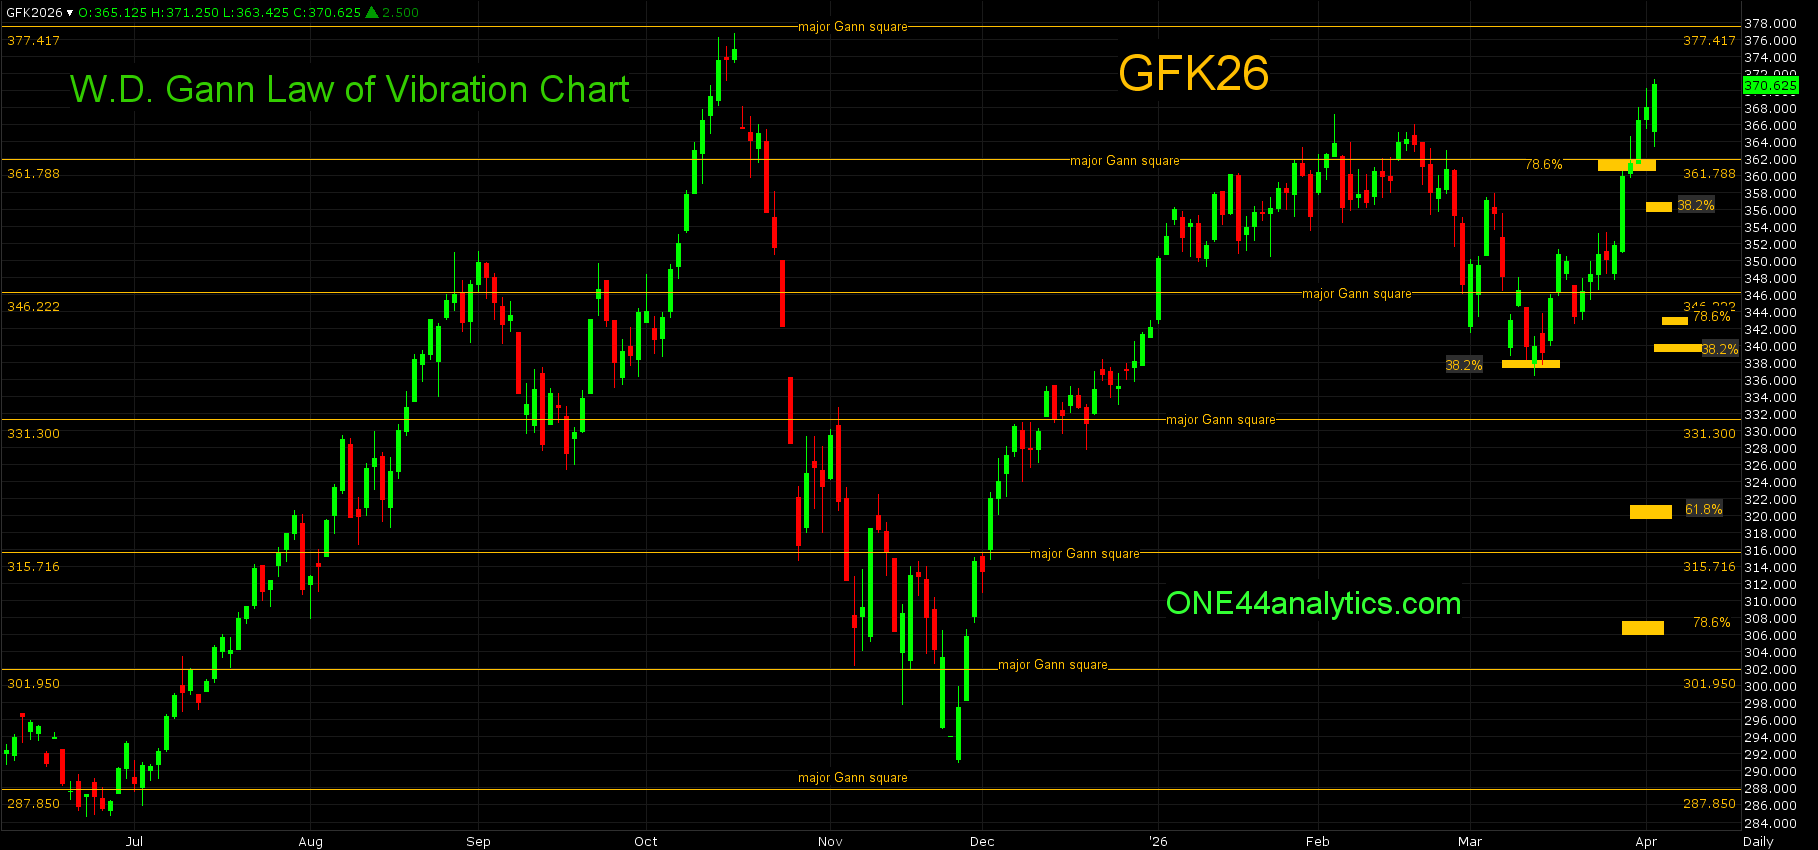
In both the Live Cattle and Feeders you can see on the chart where they held the 38.2% level, for Live Cattle it was on 3/9/26 and in Feeders it happened on 3/12/26.
ONE44 38.2% rule,
A 38.2% level keeps the trend intact and new highs/lows should follow.
As you can see the rallies from this 38.2% Fibonacci retracement did send it to a new high, we were watching the 78.6% retracement back to the high, but it couldn't turn the market lower and the Bull market continues.
ONE44 Analytics where the analysis is concise and to the point
Our goal is to not only give you actionable information, but to help you understand why we think this is happening based on pure price analysis with Fibonacci retracements, that we believe are the underlying structure of all markets and Gann squares.
If you like this type of analysis and trade the Grain/Livestock futures you can become a Premium Member.
You can also follow us on YouTube for more examples of how to use the Fibonacci retracements with the ONE44 rules and guidelines.
Sign up for our Free newsletter here.
FULL RISK DISCLOSURE: Futures trading contains substantial risk and is not for every investor. An investor could potentially lose all or more than the initial investment. Commission Rule 4.41(b)(1)(I) hypothetical or simulated performance results have certain inherent limitations. Unlike an actual performance record, simulated results do not represent actual trading. Also, since the trades have not actually been executed, the results may have under- or over-compensated for the impact, if any, of certain market factors, such as lack of liquidity. Simulated trading programs in general are also subject to the fact that they are designed with the benefit of hindsight. No representation is being made that any account will or is likely to achieve profits or losses similar to those shown. Past performance is not necessarily indicative of future results.

/A%20close-up%20of%20a%20SpaceX%20sign%20by%20Sundry%20Photography%20via%20Adobe%20Stock.jpeg)

/AI%20(artificial%20intelligence)/AI%20chip%20by%203Dsss%20via%20Shutterstock.jpg)
