
- I know the industry in general is atwitter over Wednesday's USDA Supply and Demand reports, but what w need to remember is the numbers are imaginary for the most part.
- We don't know, won't know actual numbers like acreage, yield, production, etc., but we can solve for available stocks-to-use, the bottom line of immediate supply and demand.
- To understand long-term fundamentals all we have to do is read Cost of Carry tables.
It’s hard to believe but we’ve already arrived at another round of USDA Supply and Demand reports. It will be interesting to see what how the majority of ag industry talking heads handle the next round of made-up government numbers following a mid-term election day that promises to provide no details as to who won or lost. My guess is results will be tied up for months. But let’s not worry about that now. Instead, let’s focus on what we do know: Real grain market fundamentals.
Before we dive in, let’s go over the basics: We don’t know, won’t know, what any of the actual numbers are (e.g. acres, yield, production, etc.), but by using my correlation between national average cash price and available stocks-to-use (as opposed to imaginary ending stocks-to-use) we can gauge what immediate supply and demand is at any time.

Corn: At the end of October the national average cash price was $6.9675, correlating to an available stocks-to-use figure of 8.3%. At the end of September these numbers were $6.7850 and 8.4% meaning the supply and demand situation tightened during October despite the bulk of the 2022 harvest being done. At the end of October 2021, the numbers were $5.5150 and 10.3%, again telling us baseline fundamentals were tighter this year than last year at the same time. This fits with what we are seeing in the national average basis market as well, with the calculation finishing October 2022 at 5.0 cents over December futures as compared to the previous October’s figure of 14.0 cents under December. Given all this, we know immediate supplies are tighter in relation to demand, but what about long-term expectations? The Dec22-July23 futures spread closed October at an inverse of 2.25 cents while the end of October 2021 saw the Dec21-July22 spread close at a carry of 10.5 cents. Again, this tells us the long-term supply and demand outlook is tighter than a year ago. End of story.
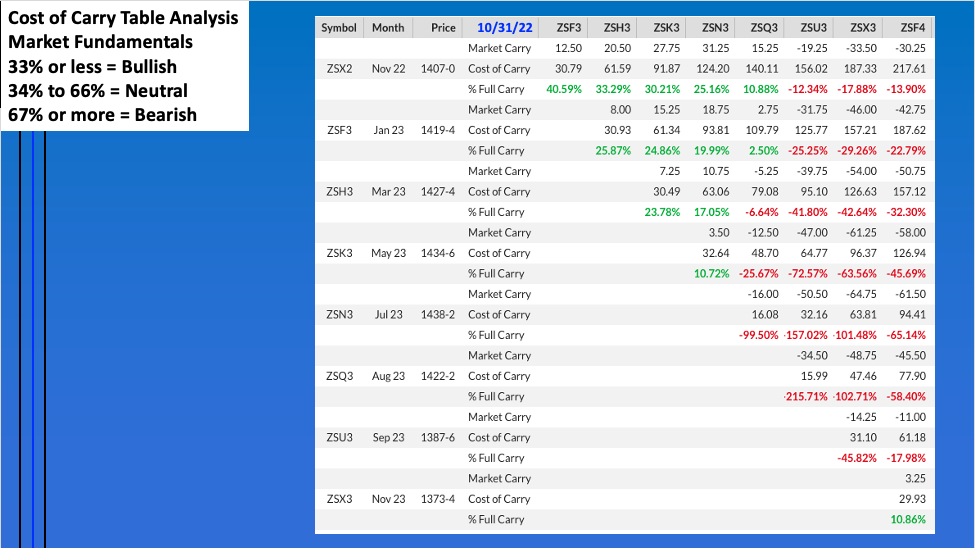
Soybeans: Okay, maybe not the stories end, as we see a similar situation in soybeans. The average cash price at the end of October was $13.73 correlating to an available stocks-to-use of 5.4%. The end of September saw the numbers come in at $13.1825 and 6.3%, while October 2021 posted $11.96 and 8.8%. Basis is a tougher nut to crack given the end of October coincides with the roll from November futures to January, but if we keep the playing field even we see last month finished with basis 38.5 cents under November as compared to 2021’s October final figure of 39.6 cents under. Immediate supplies are tight in relation to demand. Further out, the Nov22-July23 futures spread closed last month covering 25% calculated full commercial carry (cfcc), with 33% or less considered bullish. Last October saw the Nov21-July22 spread finish covering 46% cfcc. You know the end: Long-term supply and demand is tighter this time around the calendar.
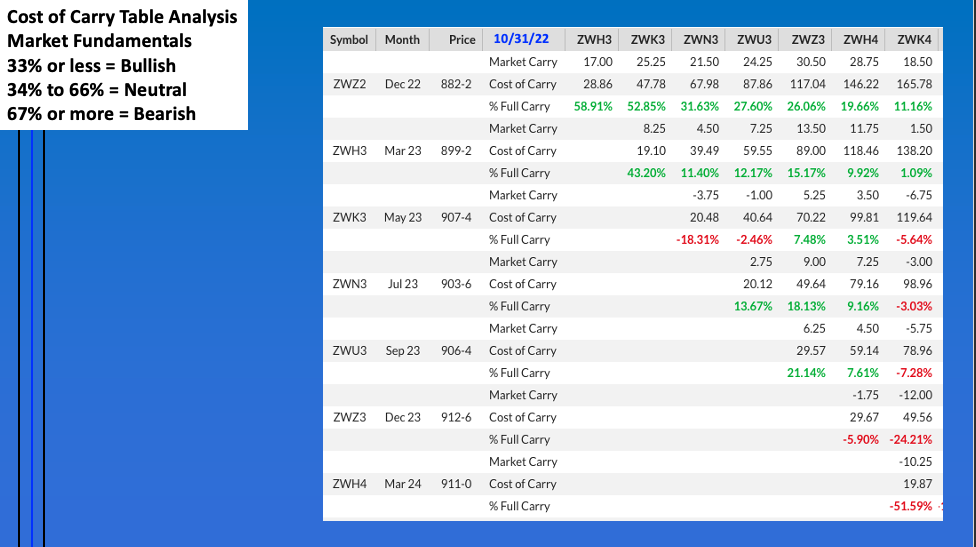
Chicago (SRW) Wheat: For the sake of posting something different, Chicago (SRW) finished October with an average cash price of $8.24 and correlating to available-stocks-to-use of 27.4%. The previous month showed $8.6075 and 26% meaning there was a market that loosened up a bit during October. However, 2022 was still tighter than October 2021’s numbers of $7.2675 and 31.8%.
While day-traders try to get rich Wednesday playing USDA’s latest round of Keno[i], long-term market investors already know real market fundamentals.
[i] I get a good laugh out of Keno. I’ve been to Las Vegas a number of times, often winding up at the bar or restaurant. You can see the folks who have lost almost everything walk in and buy a Keno ticket or 10, trying to make everything back. What is Keno? After selling you a ticket, the House picks ‘random’ numbers that decides if you win or lose. Now, what do you think the chances are of winning?
More Grain News from Barchart
- Commercial Trader Interest Grew During the Soybean Harvest
- Cocoa Prices Underpinned by Ivory Coast Dock Workers Strike
- Sugar Climbs on the Outlook for Smaller Global Supplies
- Coffee Prices Fall on Favorable Brazil 2023/24 Coffee Crop Prospects


