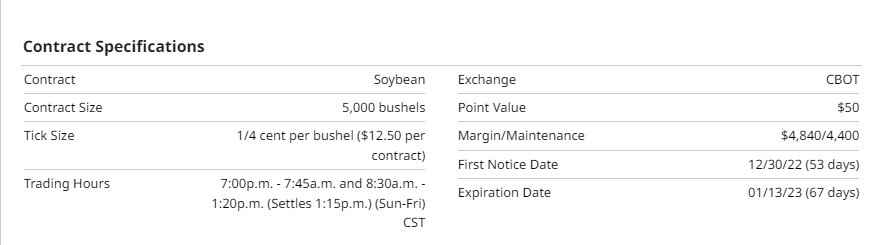
Specifications and Statistics
Soybean is the common name for the annual leguminous plant and its seed. The soybean is a member of the oilseed family and is not considered a grain. The soybean seeds are in pods containing 20% oil and 40% protein. Soybeans were an ancient food crop in China, Japan, and Korea and were only introduced to the US in the early 1800s. Today, soybeans are the second-largest crop produced in the US, behind corn. Soybean production in the US is concentrated in the Midwest and the lower Mississippi Valley. Soybean crops in the US are planted in May or June and are harvested in autumn. Depending on growing conditions, soybean plants usually reach maturity 100-150 days after planting.
Source: Barchart-CRB Yearbook
Soybean futures are very popular and widely traded around the world. While Soybeans originated and were first produced in China during the 11th century BC, the first soybean futures market didn't begin trading in the US until 1940.
Brazil ranks as the world's largest producer of soybeans, followed by the US. China is the largest importer of soybeans, followed by Pakistan.
After being harvested, soybeans can be crushed into soybean meal, used for livestock feed, or turned into soybean oil. Soybean oil has many uses, including cooking oils, plastics, and bio-diesel production.
Over 70% of soybeans grown in the US are used for animal feed, with poultry being number one, followed by hogs, dairy, beef, and aquaculture. China imports soybeans to feed the world's largest pork herd. In April 2022, there were 784 million pigs worldwide, meaning China was home to more than half of the global herd with 450 million heads.
The United States Department of Agriculture (USDA) releases multiple reports throughout the year that analysts and traders use to understand the supply/demand of soybeans:
- World Agricultural Supply and Demand Estimates (WASDE) Report
- Crop Production
- Planting Intentions
- Grain Stocks
Source: CMEGroup
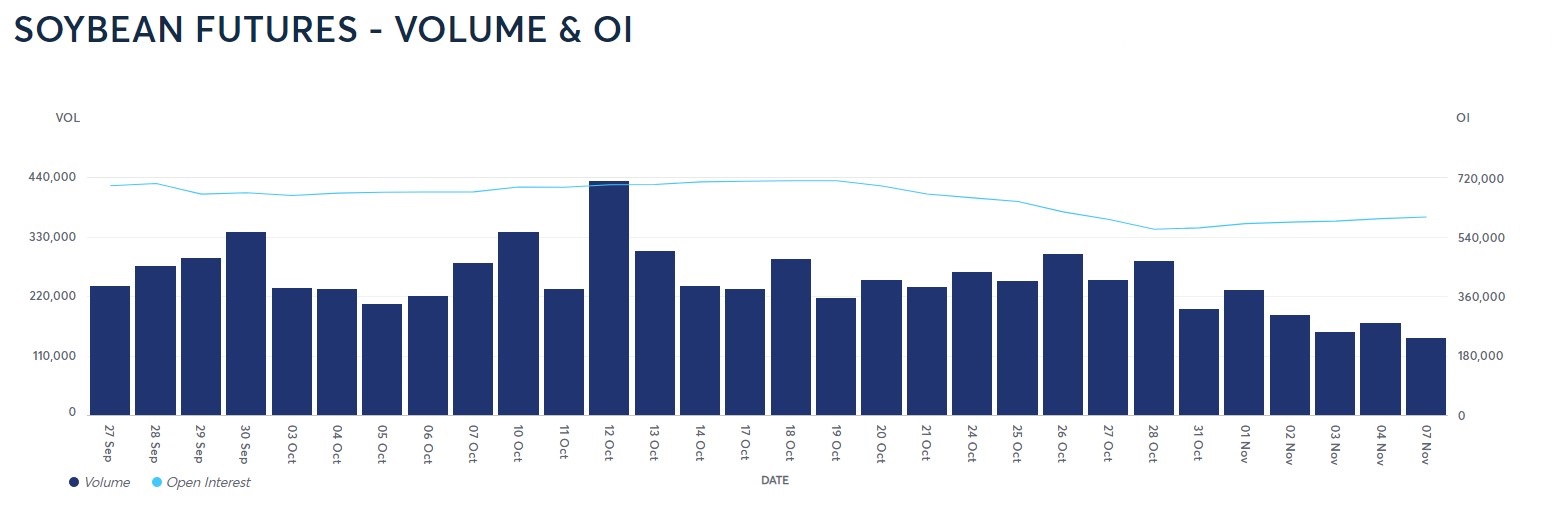
Soybean futures are very liquid and trade an average of 275K contracts daily. Open interest averages 650K-700K cumulative contracts.
Recent Performance
Soybeans have been in a trading range recently and returned 2.8% over the recent 3-months. Year-to-date have double-digit returns of 14.1%.
During these periods, several events contributed to the positive returns:
- Geopolitical events in Ukraine
- Geopolitical events affecting the energy markets
- Inflation and Supply Chain disruptions
- The drought caused grain barges to have difficulties on the Mississippi river getting to the Gulf of Mexico for exporting business.
Fundamentals Impacting Market Behaviour
Typically, November is a quiet time for the grain markets as the harvest season is ending. Traders will watch the Brazillian weather as we get closer to the end of December, as meteorologists confirm that La-Nina weather patterns persist for a third year. Brazil recently finished planting its next crop of spring soybeans, to be harvested in early February.
Last week Russia announced they would not support the passage of grain vessels, and the grain markets immediately traded higher. Later, when Russia announced that it would continue supporting the grain vessels, the markets instantly declined. The market will continue to watch events coming out of the Black Sea to understand better the export capacity leaving the Ukraine region.
On November 9th, the USDA will release the monthly WASDE report. The November report is usually a small market mover due to the end of the harvest season, and the supply numbers are well-known. Barring any surprises to the supply or demand side, the markets will need another stimulus to move them.
Spreads
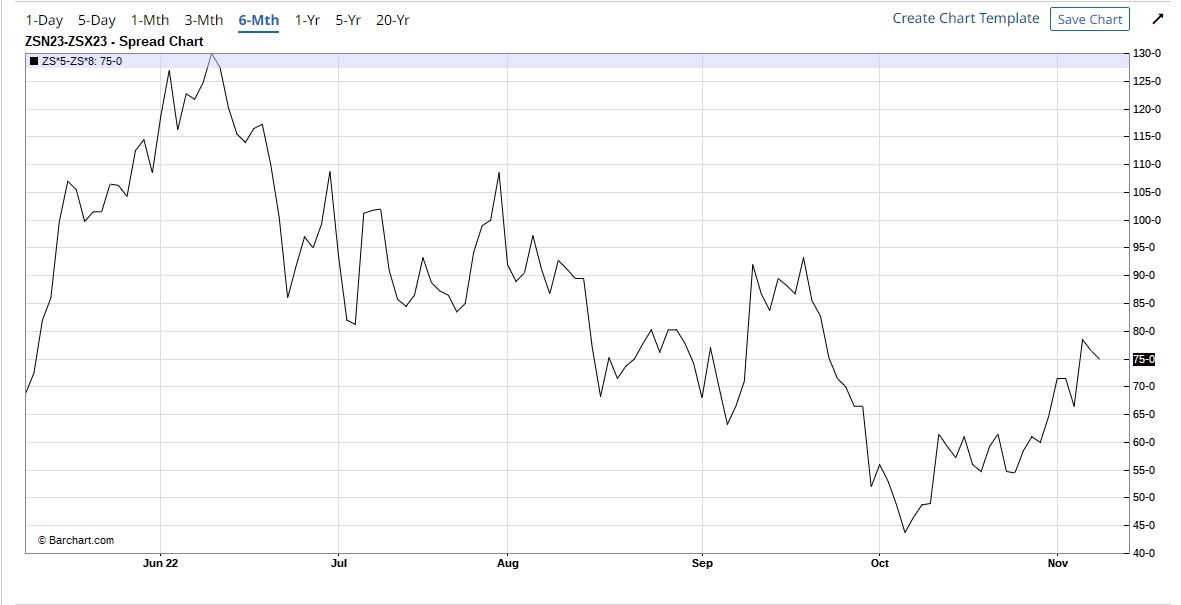
Soybean's old crop – new crop spread bottomed in October and now has an uptrend based upon higher highs and higher lows. For this spread to be in an uptrend typically, it would mean the July (old crop) contract is being aggressively bought, and the November (new crop) contract is bought with less demand- a bullish pattern.
Technicals
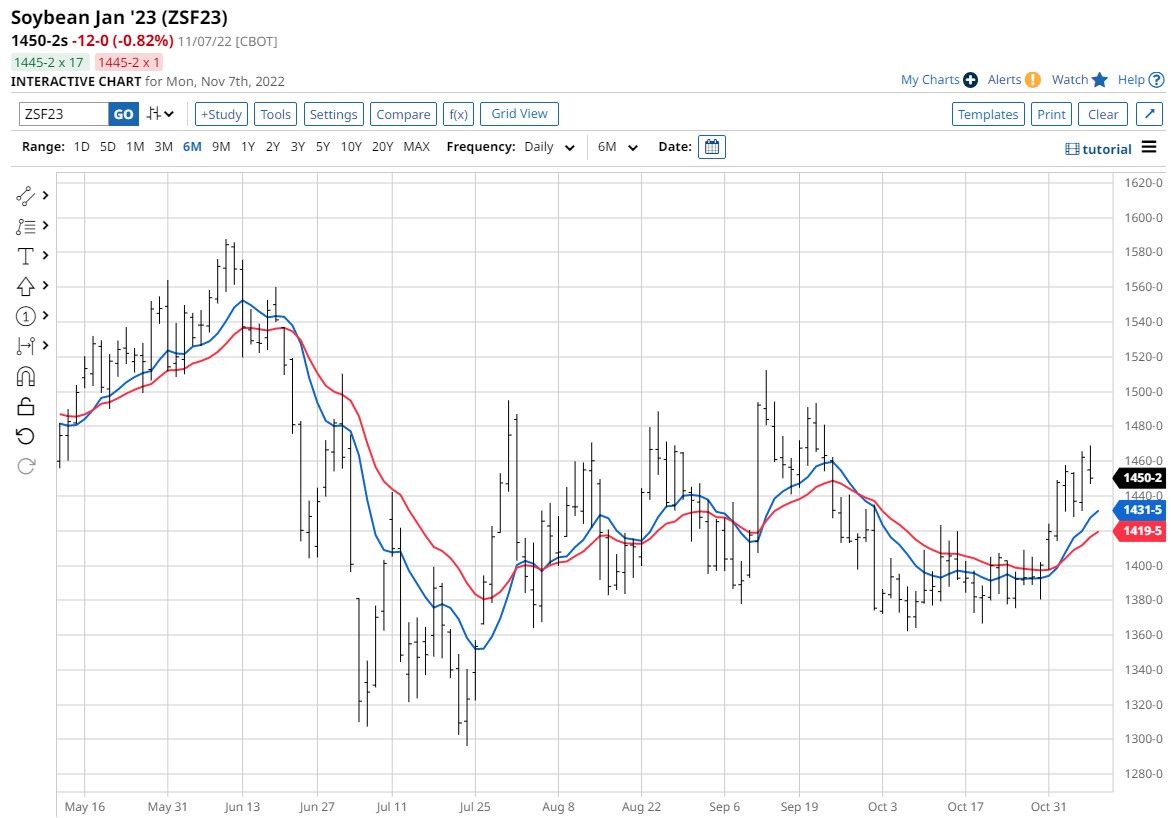
In October, the January soybean futures market reached the bottom of a sizeable sideways channel; it built a base for most of October. In November, soybeans broke out, and the 10 and 20 EMAs turned up.
The first area of resistance appears to be the 1500'0 area. Possible support appears around the 1400'0-1420'0 area.
Seasonality
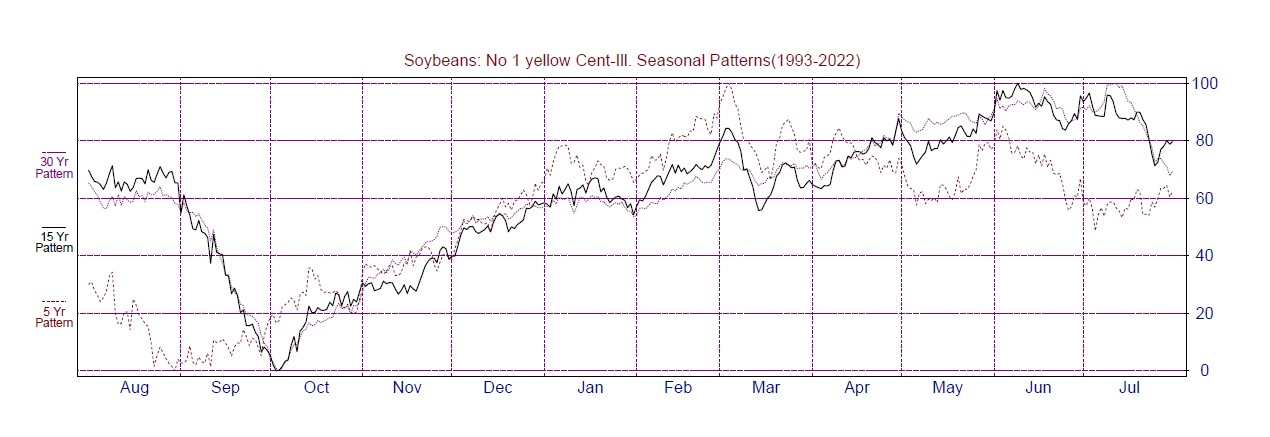
Source: Moore Reseach Center, Inc (MRCI)
MRCI has researched the cash soybean market and found that during the past 15-30 years, soybeans have put in their seasonal low in early October. The harvest season has the highest supply period of the year. Thus, allowing exporters and processors of soybeans to lock in low seasonal prices for future delivery.
The Commitment of Traders (COT) Report Analysis
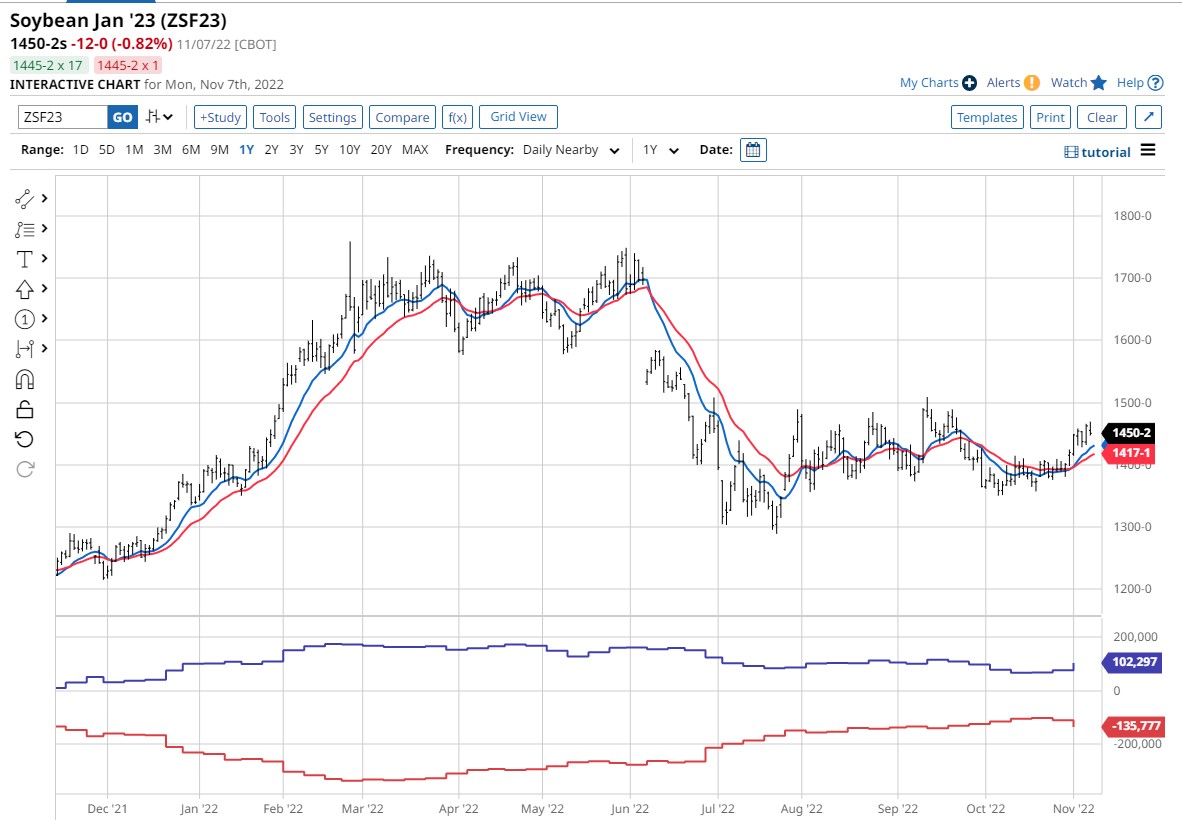
The above COT report chart for soybeans has a one-year look back. Perfectly illustrated is the commercial traders (red line) aggressive buying of soybeans and pushing their net position to the most bullish they had been over the past year. While soybeans were trading sideways from July to November, commercial traders were buying. Commercial traders reached their bullish peak position just as the low seasonal pattern came in October.
Managed money (blue line) had been reluctant to commit much capital to soybeans while trading sideways. But, over the past two weeks, managed money has begun buying again, as seen by the rising blue line.
Summary
Traders can participate in soybeans through a few different venues. The standard-size soybean (ZS) futures contract is available, but if the risk is too big, there is a mini-soybean (XK) futures contract. There are also options on the futures, but only to be used by option-savvy traders. For equity traders, there is an ETF (SOYB) available.
With inflation still running rampant, the supply chain issues and water levels on the Mississippi River, and the ongoing geopolitical situation, soybeans deserve a trader's attention to see if there are any opportunities.
Seasonally soybeans appear to have put in their seasonal low. During this time, commercial traders built their bullish position more than at any other time in the past year. The old crop-new crop spread has formed a daily uptrend off these October lows. The daily soybean chart illustrates an uptrend using the 10-20 EMAs.
No trade is without risk, but trades with multiple criteria supporting the market direction usually offer better rewards than without.
More Grain News from Barchart
- Cocoa Prices Underpinned by Ivory Coast Dock Workers Strike
- Sugar Climbs on the Outlook for Smaller Global Supplies
- Coffee Prices Fall on Favorable Brazil 2023/24 Coffee Crop Prospects
- Wheats Heading Lower on Tuesday
/Super%20Micro%20Computer%20Inc%20HQ%20photo-by%20Tada%20Images%20via%20Shutterstock.jpg)
/Micron%20Technology%20Inc_billboard-by%20Poetra_RH%20via%20Shutterstock.jpg)

/Broadcom%20Inc%20logo%20on%20building-by%20Poetra_%20RH%20via%20Shutterstock.jpg)
