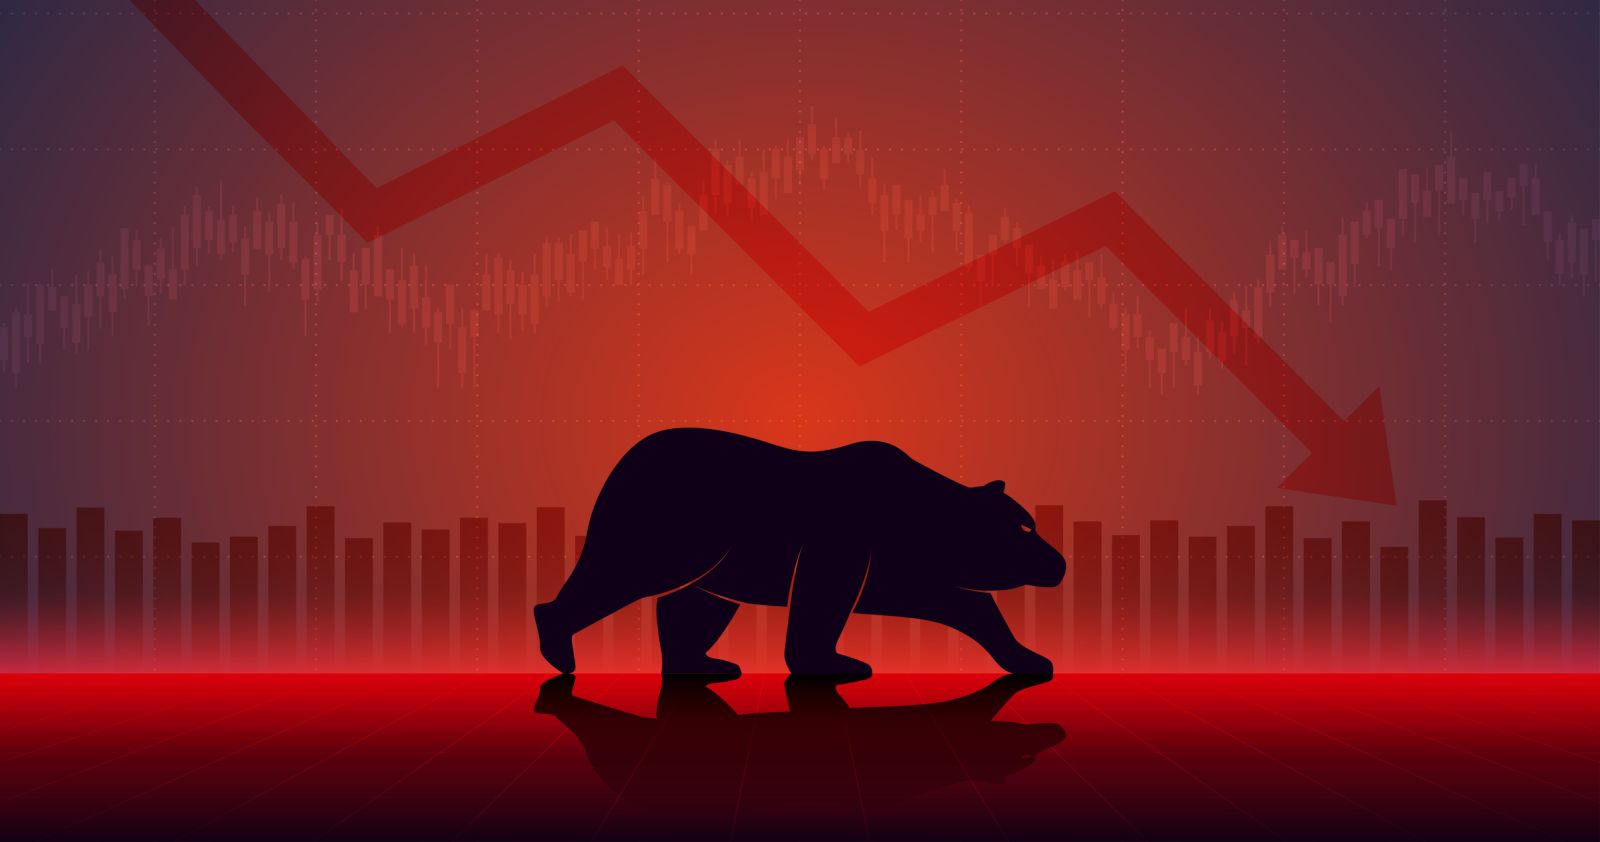
When markets break down, as we’ve seen recently, I get to work on the data. In particular, I want to identify potential contrarian situations. Here’s one I’m looking into, as the S&P 500 Index ($SPX) nears a 10% decline from its highs earlier this year.
I sought out stocks that, while they are among the 100 largest in the S&P 500, have shown the potential to march to the beat of their own drum. That is, they have exhibited low correlation to the other 99 stocks in the S&P 100 Index ($ONE). As a result, they may offer some relative return, regardless of future market direction.
I started by running a chart that has way too much data to share here. It was a “cross correlation” box, which compared every one of those 100 stocks to the others, over the past six months. That’s the period over which the S&P 500 and the S&P 100 have really struggled.
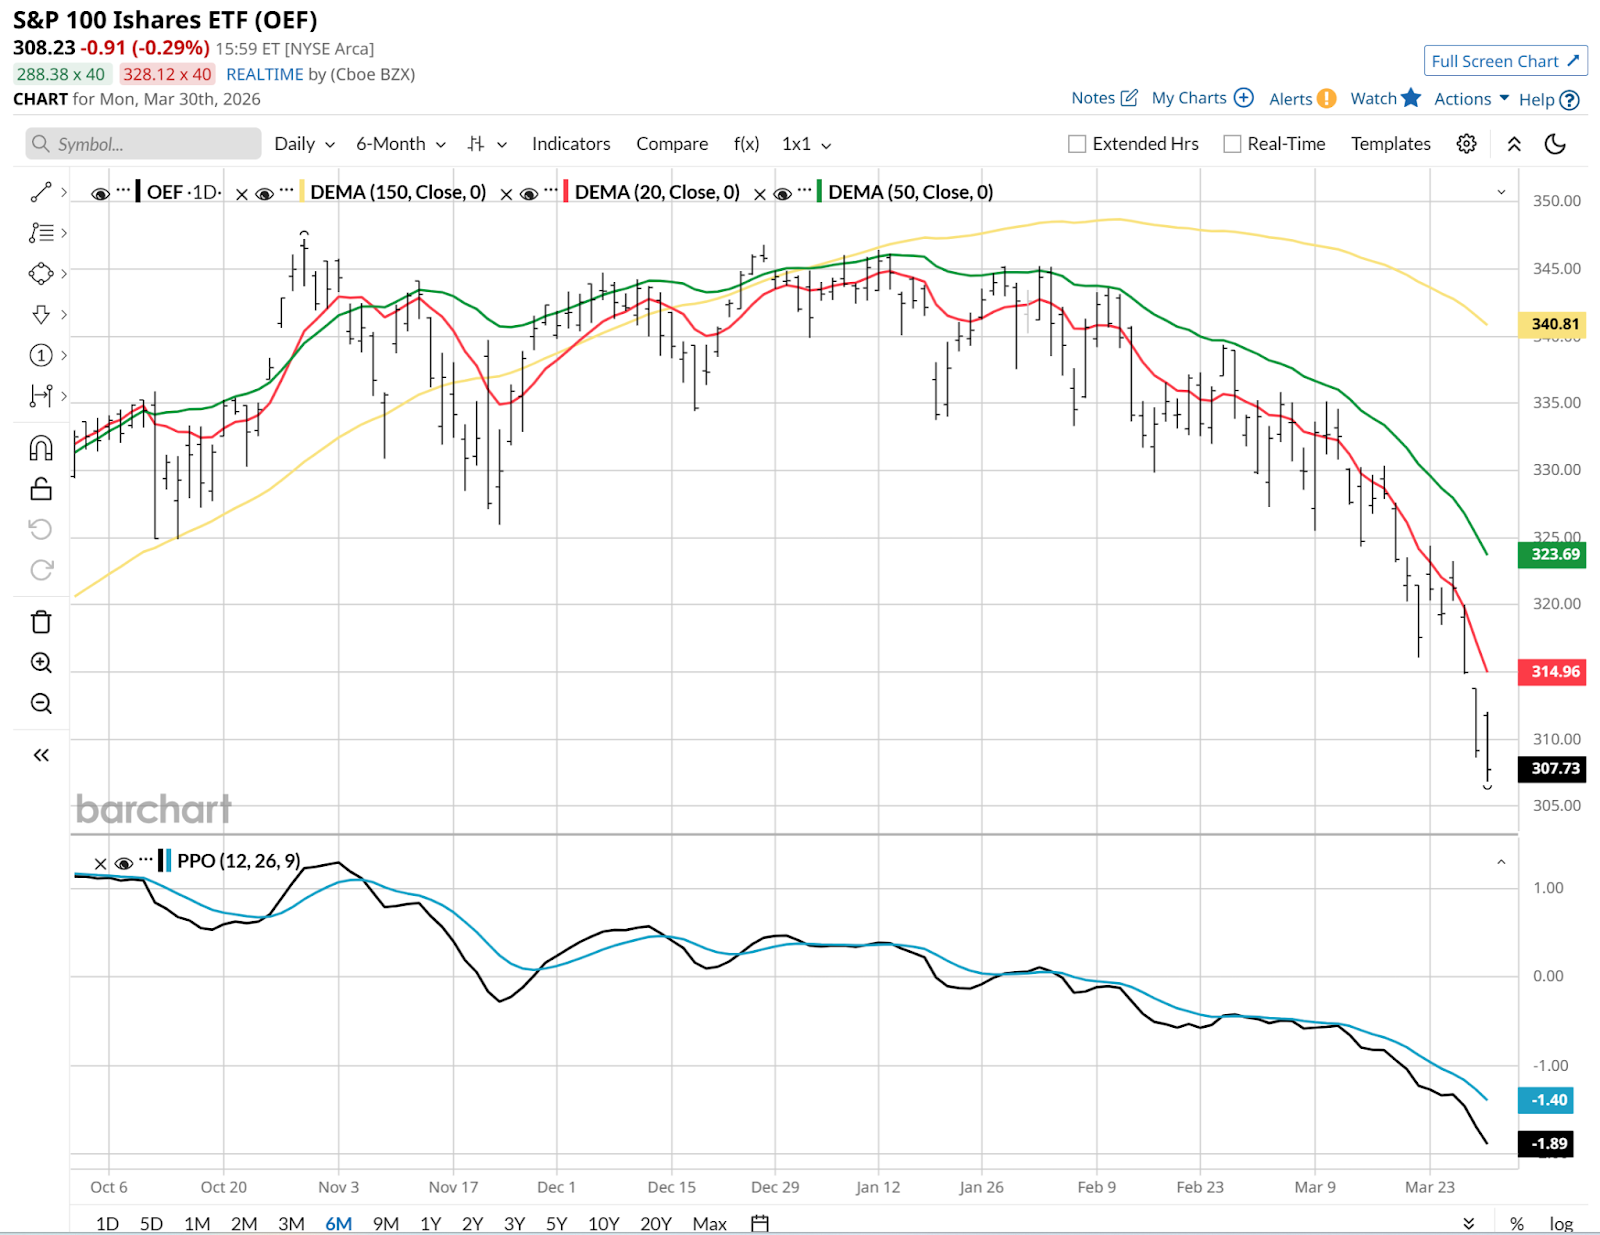
Here’s the S&P 100 ETF (OEF) over the past six months. During that time, we’ve seen all three of the moving averages I typically show in my charts (20-day, 50-day, 150-day) roll over. That’s a terrible look for investors aiming to make positive returns.
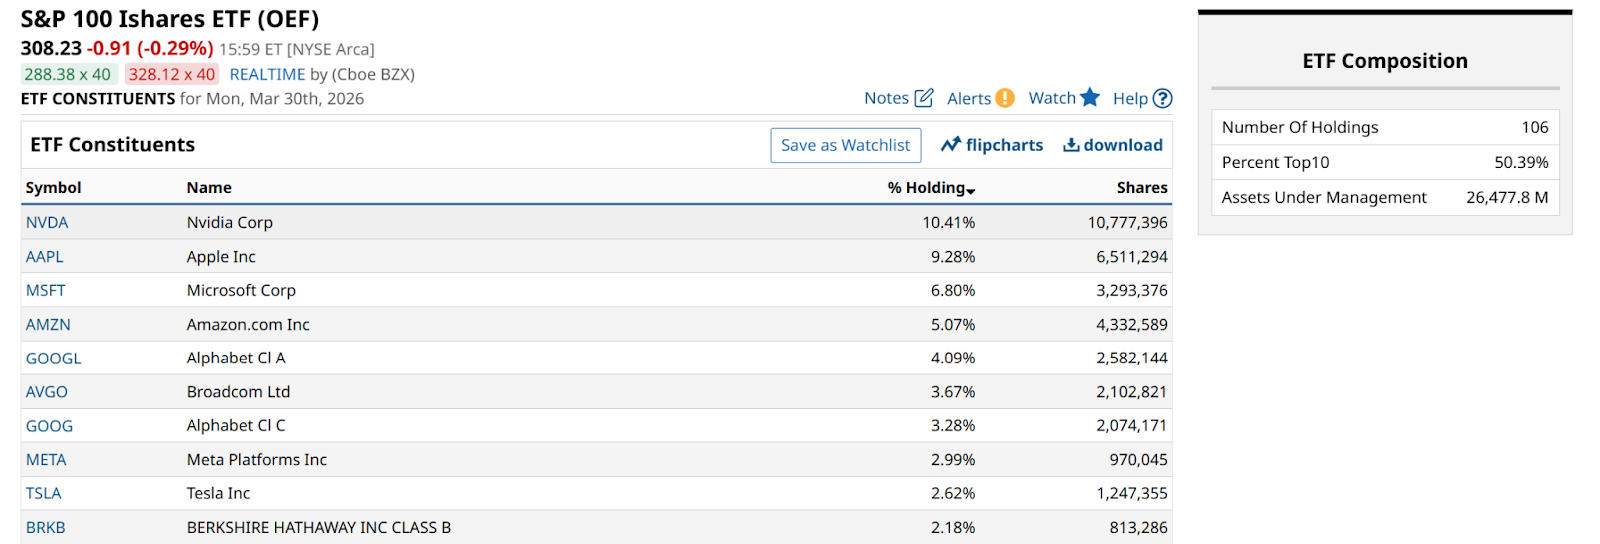
And, while that index has about 100 names, we can see that the 10 biggest account for half of the weighting. Yes, even among the biggest stocks, the “Magnificent 7” and a few others still run the show.
So, it makes sense to look through the entire list, since the market index would not reflect strong moves by any of the stocks below the giant companies.
For each of the 100 stocks, I examined each one’s correlation to all 99 others, then averaged those readings. The result was a list of the S&P 100 members that have moved most independently of their peers in that benchmark.
I kicked out the energy names, since we know those are a direct play on what’s happening in the Middle East right now. I prefer to identify stocks that are, relatively speaking, minding their own business, moving their own way. With earnings season coming up, perhaps those earnings releases could be a spark.
Here are the charts of the three I found most intriguing. In a market where finding a stock chart that looks great is darn near impossible, at least this lower-correlation angle might be a good hunting ground for stocks to buy soon.
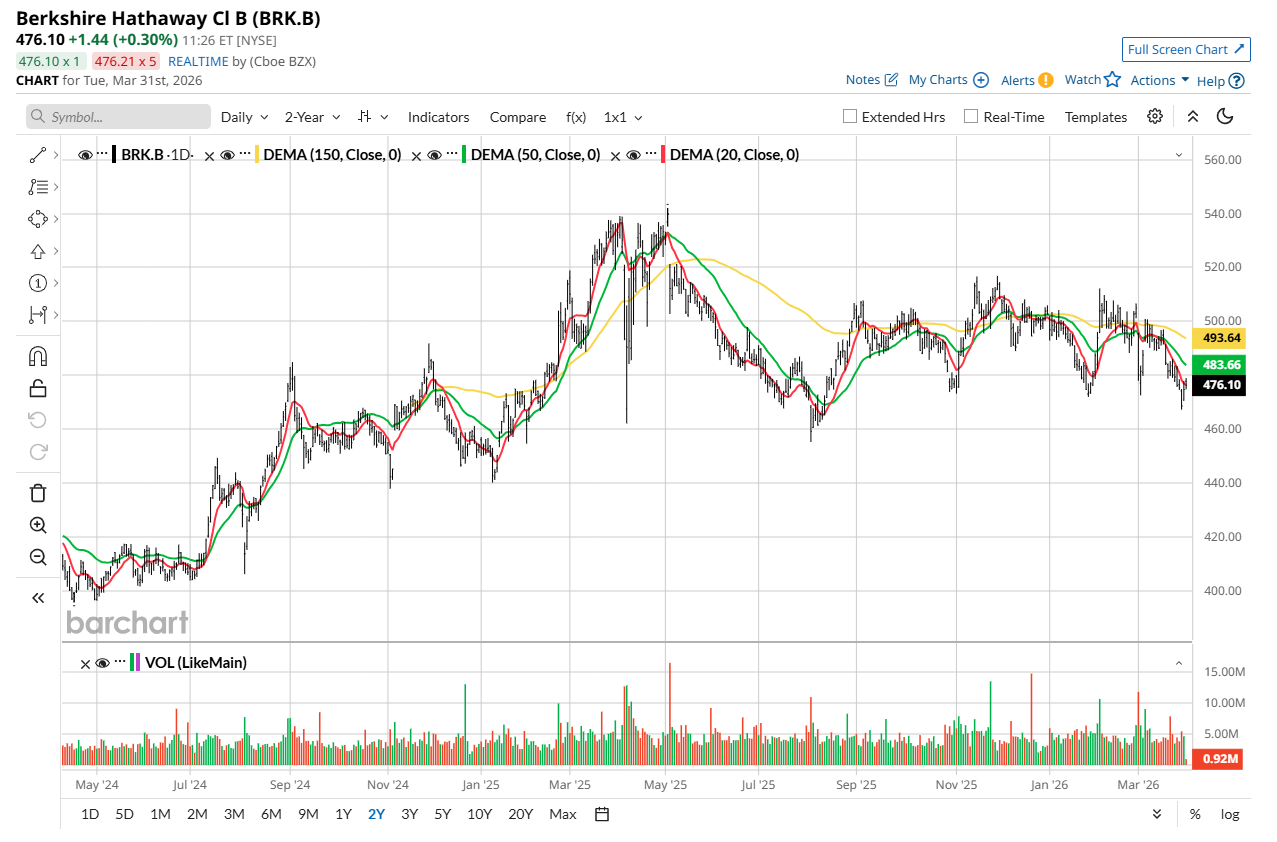
Berkshire Hathaway (BRK.B)
Average correlation to other 99 stocks: -0.012
The best thing I can say about this Berkshire Hathaway (BRK.A) (BRK.B), chart-wise, is that it does not look like a bear sliding down a hill on a sled. Because that’s what many of them look like! That $460 area looks to be the “tell” for this one, near-term. And with practically zero correlation to the rest of the bunch, and new management at the helm, there’s a fighting chance here.
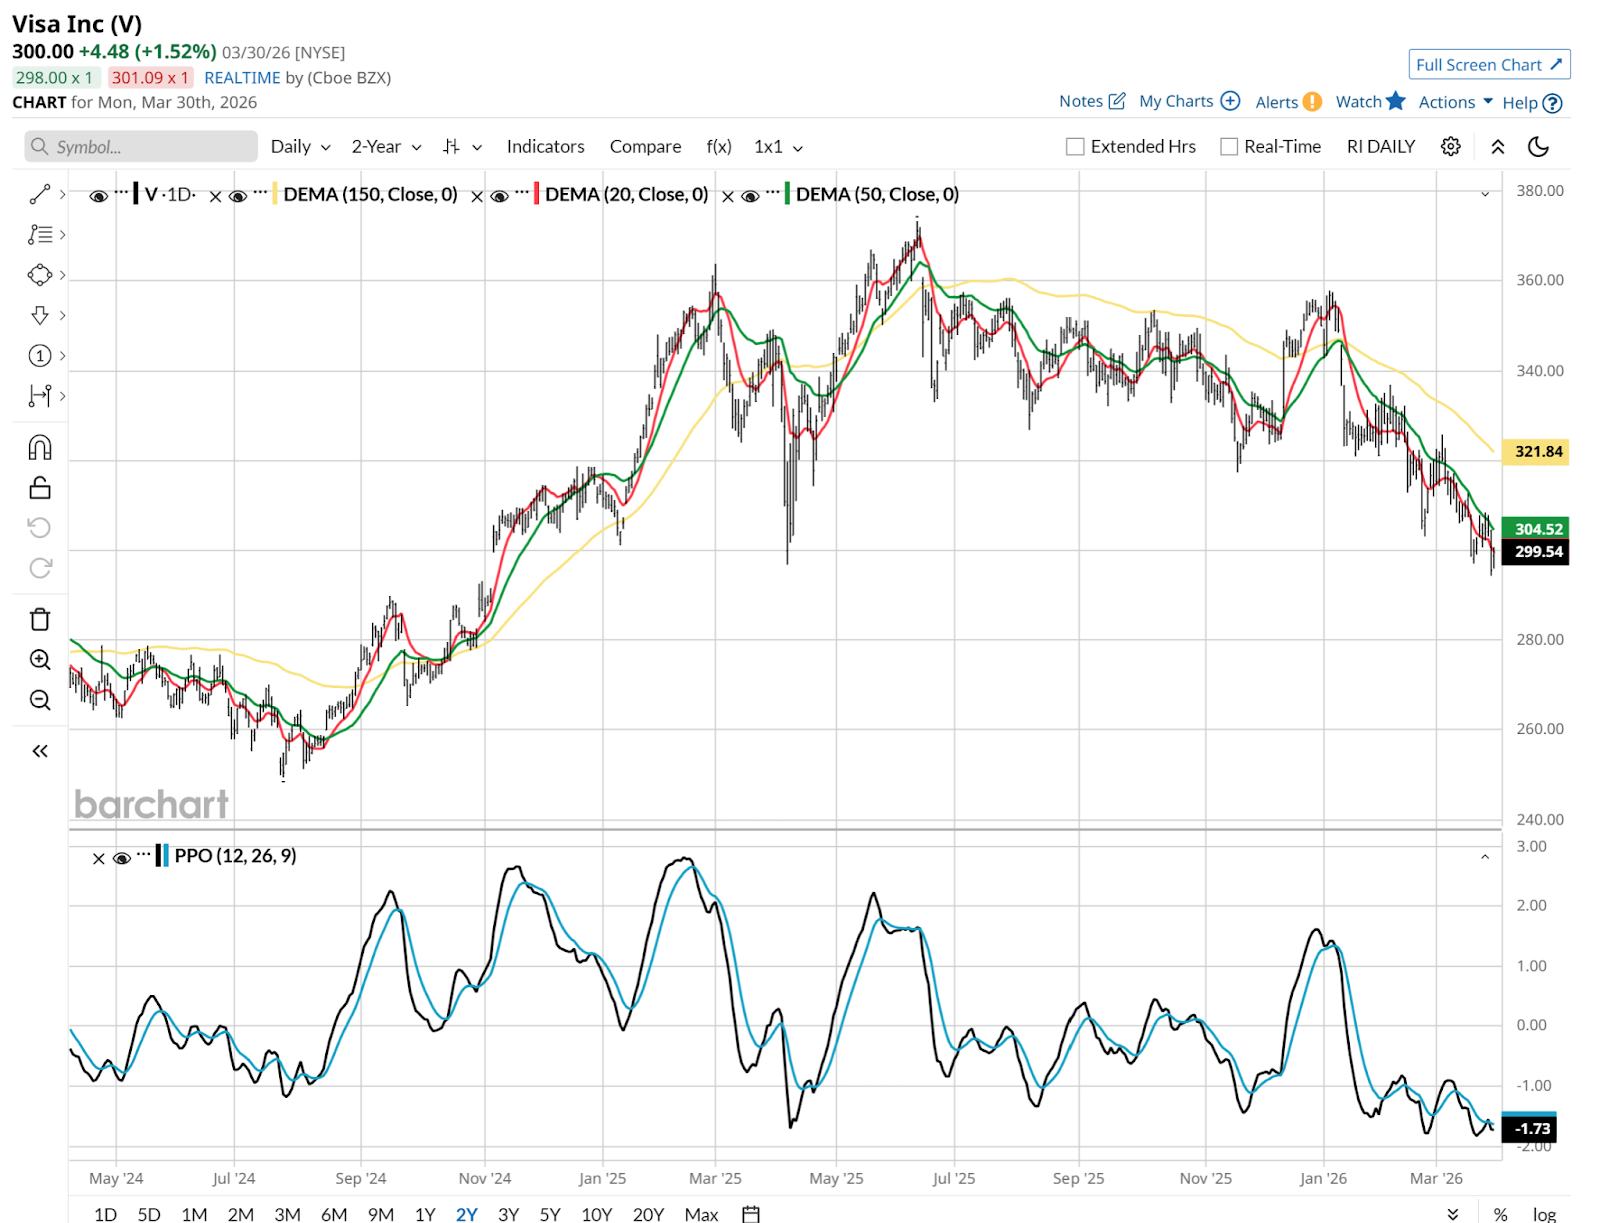
Visa (V)
Average correlation to other 99 stocks: 0.368
I’m bottom-fishing here, for sure. Since late 2024, Visa (V) has round-tripped from $300 a share to $375, back to $300. But we technicians recognize that markets have a memory. And that $300 area has been a stop-the-bear level in recent years.
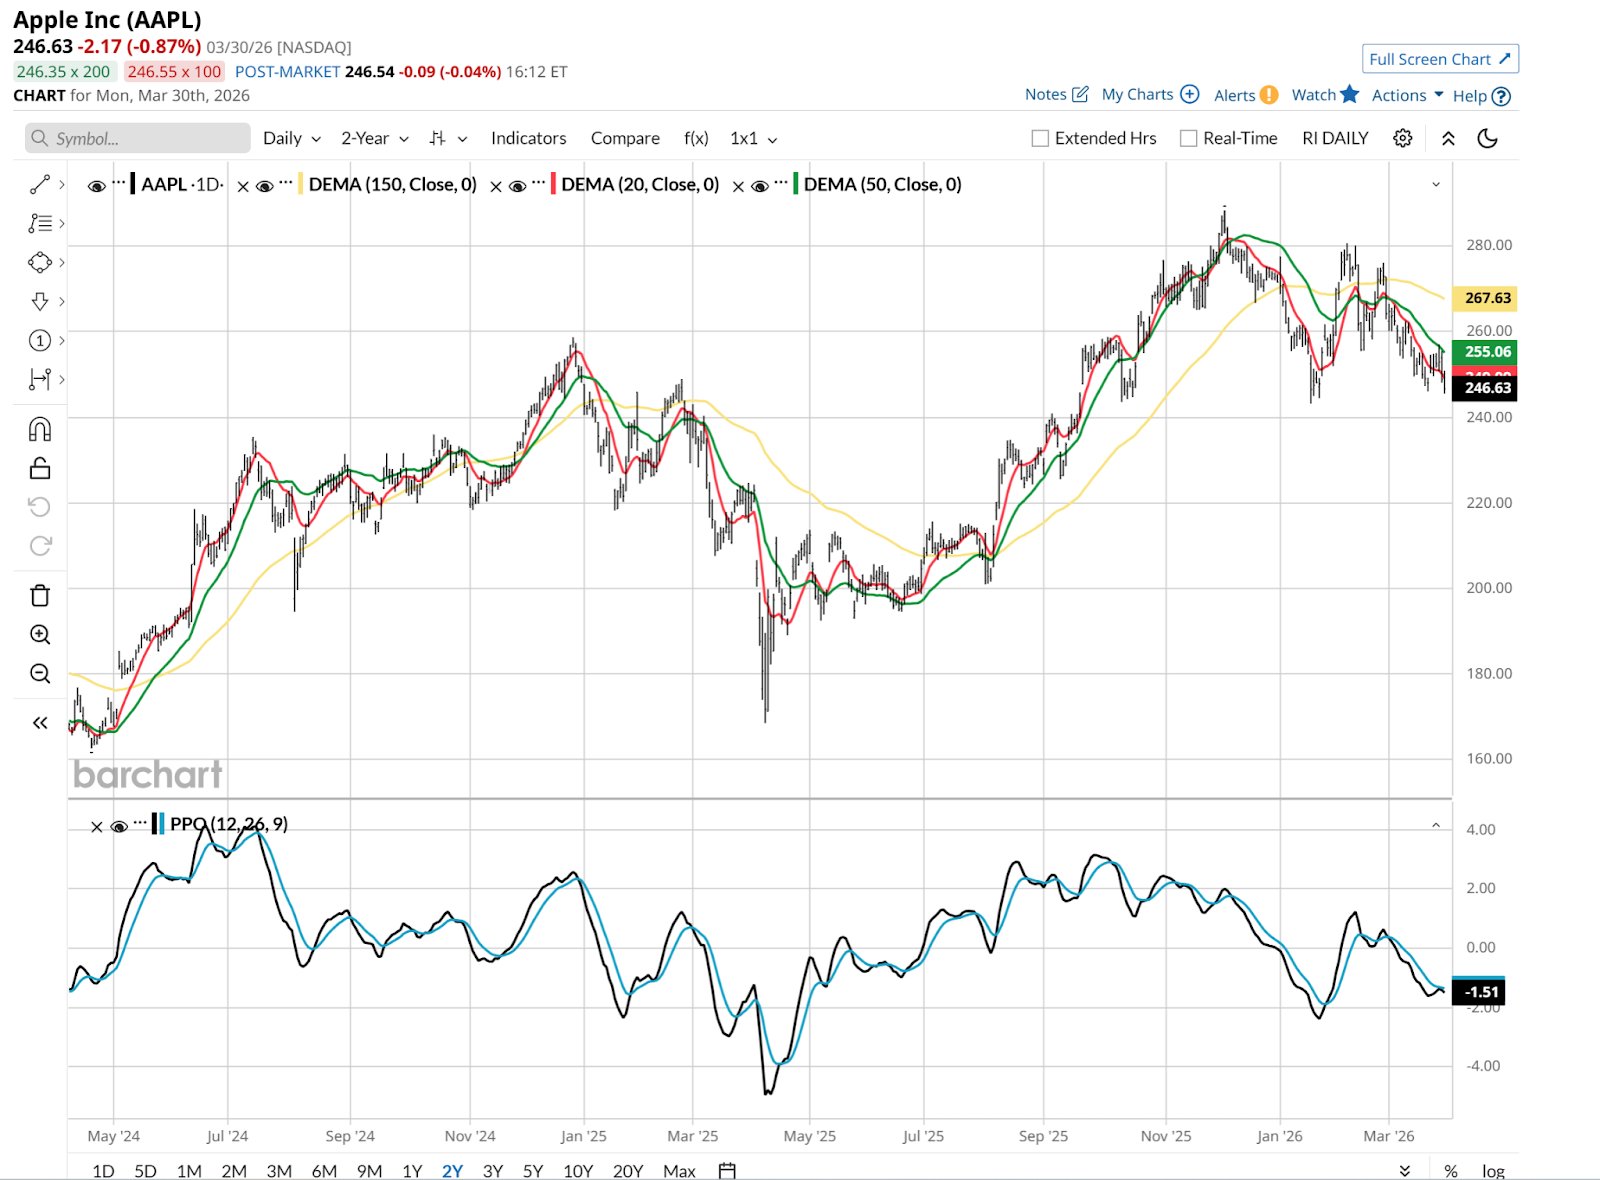
Apple (AAPL)
Average correlation to other 99 stocks: 0.428
Apple (AAPL) stock seems to be a big disappointment to many. Whether it is the mature product line, lack of a leading AI strategy, or something else, AAPL is not the first name on bullish investors' minds. But historically, it has been one to look at when it falls by this much from its high. This time could very well be different. But perhaps that lower correlation will be an asset, not a liability, soon.
I suggest keeping your eye on stocks that are out of the mainstream, but still in the S&P 500. This was merely one research exercise. However, as this market messiness continues, the more outside the box we look, the more likely we are to find answers.
Rob Isbitts created the ROAR Score, based on his 40+ years of technical analysis experience. ROAR helps DIY investors manage risk and create their own portfolios. For Rob's written research, check out ETFYourself.com.
On the date of publication, Rob Isbitts did not have (either directly or indirectly) positions in any of the securities mentioned in this article. All information and data in this article is solely for informational purposes. For more information please view the Barchart Disclosure Policy here.

/AI%20(artificial%20intelligence)/AI%20engineer%20working%20on%20laptop%20by%20ART%20STOCK%20CREATIVE%20via%20Shutterstock.jpg)
/International%20Business%20Machines%20Corp_%20logo%20on%20phone-by%20rafapress%20via%20Shutterstock.jpg)
/Micron%20Technology%20Inc_billboard-by%20Poetra_RH%20via%20Shutterstock.jpg)
/Qualcomm%2C%20Inc_%20logo%20on%20phone-by%20viewimage%20via%20Shutterstock.jpg)