
Soybean Meal Aug '10 (ZMQ10)
[[ item.lastPrice ]] [[ item.priceChange ]] ([[ item.percentChange ]]) [[ item.tradeTime ]] [CBOT]
[[ item.bidPrice ]] x [[ item.bidSize ]] [[ item.askPrice ]] x [[ item.askSize ]]
for [[ item.sessionDateDisplayLong ]]
Find the latest Soybean Meal prices and Soybean Meal futures quotes for all active contracts below.
[[ timeframe ]] futures price quotes as of Sat, May 16th, 2026.
Latest price quotes as of [[ snapshotDate ]].
[[ timeframe ]] futures price quotes, based on [[ timeframe ]] data.
Looking for expired contracts? Check out our Soybean Meal Historical Prices page.

USDA prompts bulls while Trump falls short on China orders
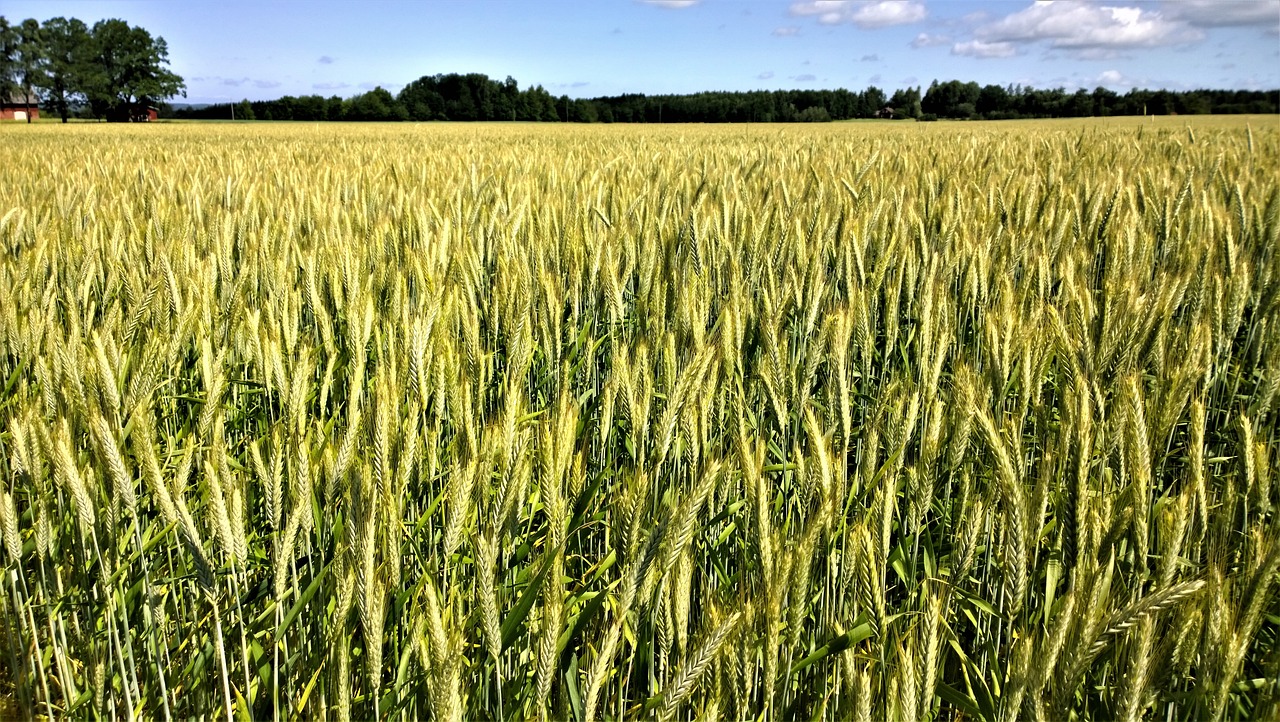
Rain arrives as wheat harvest kicks off

The Most Consistent Seasonal Trades Across Commodities—Backed by 15 Years of Data
After analyzing roughly 500,000 seasonal spread combinations across 15 years of data, several commodity markets consistently separated themselves from...
Cattle Futures Recover and End Week on a Positive Note
Cash prices surge to new all-time highs and futures bounce back
Wheat Falls into the Weekend
The wheat market retreated lower into the Friday close, with the three exchanges posting losses. Chicago SRW futures were down 11 to 22 1/4 cents on the...
Corn Falls Lower into the Weekend
Corn futures closed the Friday session with contracts falling 7 to 11 ¾ vents as July ended the week with losses of 15 ½ cents. December was12 ½ cents...

Soybeans Close Friday with Bears Pushing Lower
Soybeans were extending the late week losses with close Friday with contracts down 7 to 15 1/12 cents. July was down 31 cents on the week, as November...

TTEC Stock Should Be on Your Radar as the Little-Known Company Quietly Builds Something Rivals Will Struggle to Copy
TTEC Holdings made a move that should matter to investors. Here is why this company looks increasingly hard to compete with.
/EBay%20Inc_%20logo%20by-%20JHVEPhoto%20via%20iStock.jpg)
eBay Stock Hits New All-Time Highs as Ryan Cohen Declares ‘It Needs to Be on Ozempic’
GameStop CEO's comment may have been the catalyst in eBay's stock soaring to its highest point yet.
/AI%20(artificial%20intelligence)/AI%20Infrastructure%20by%20FOTOGRIN%20via%20Shutterstock.jpg)
AXT Turned the AI Data Center Boom Into an 8,436% 1-Year Return
AI infrastructure spending is reshaping the semiconductor supply chain in unexpected ways. AXT emerged as one of the market’s top performers by supplying...

Lockheed Martin Stock Looks Well-Positioned to Get a Big Lift From the Very Costly Golden Dome Initiative
LMT stock shows multiple, positive catalysts, with the Golden Dome being among the largest.
/AI%20(artificial%20intelligence)/Artificial%20Intelligence%20technology%20concept%20by%20NicoEINino%20via%20Shutterstock.jpg)
Cerebras Is the Biggest IPO of the Year. If You Buy CBRS Stock Now, Brace Yourself for Volatility Ahead.
There's a lot of enthusiasm about this Nvidia competitor. What exactly is drawing investors?

Ford’s EV Pivot Was Disastrous. Now It’s Trying to Compete with Tesla on Energy Storage.
Ford, which failed to meet its ambitious EV targets, is now betting on the energy storage business. Can the company compete with Tesla there?
/Dell%20Technologies%20by%20Poetra_RH%20via%20Shutterstock.jpg)
Dell Stock Just Had Its Best Week Since 2024. The Odds of Another Surge Are High.
Shares of Dell just logged their strongest weekly gain in over two years. With AI server demand surging, investors are now asking whether the rally still...
/AI%20(artificial%20intelligence)/AI%20technology%20-%20by%20Wanan%20Yossingkum%20via%20iStock.jpg)
Alibaba Profit Fell Sharply, But Full-Stack AI Moved From Incubation to Commercialization. What This Means for BABA Stock.
Despite Alibaba Group's report of a sharp drop in profitability, its full-stack AI business could be seen as a pivot in the right direction.