Hard Red Winter Wheat Jul '26 (KEN26)
[[ item.lastPrice ]] [[ item.priceChange ]] ([[ item.percentChange ]]) [[ item.tradeTime ]] [CBOT]
[[ item.bidPrice ]] x [[ item.bidSize ]] [[ item.askPrice ]] x [[ item.askSize ]]
for [[ item.sessionDateDisplayLong ]]
Find the latest Hard Red Winter Wheat prices and Hard Red Winter Wheat futures quotes for all active contracts below.
[[ timeframe ]] futures price quotes as of Mon, Jul 27th, 2026.
Latest price quotes as of [[ snapshotDate ]].
[[ timeframe ]] futures price quotes, based on [[ timeframe ]] data.
Looking for expired contracts? Check out our Hard Red Winter Wheat Historical Prices page.

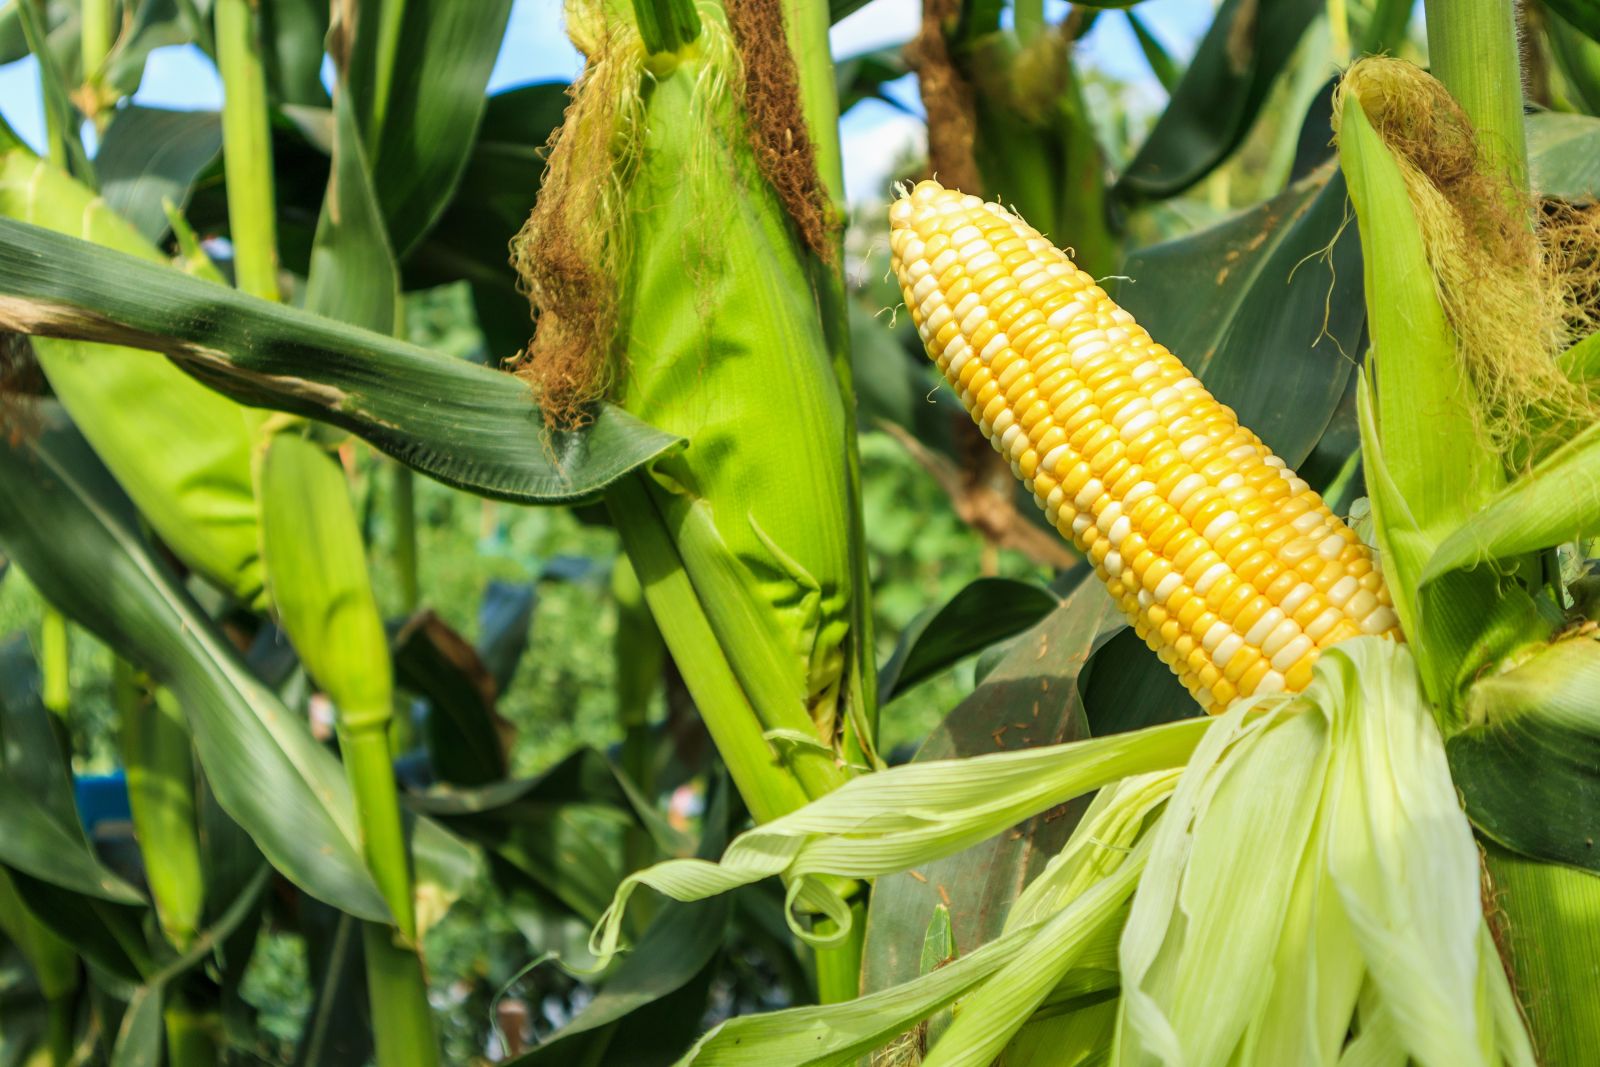
Hazardous Heat in the Midwest Is Stoking Corn and Soybean Prices. What to Watch Next.
Bulls are getting a kick from hot and dry weather spreading across the U.S.
WRT World Agricultural Supply and Demand July 27
Grain Market Fundamentals & Trade Ideas

Soybeans Collapsing Lower with Weather and Outside Pressures
Soybeans are trading with 41 to 42 ¼ cent losses across most contracts on Monday. The cmdtyView national average Cash Bean price is 41 1/2 cents lower...
Corn Facing Monday Losses on as Crude Oil Retreats
Corn futures are trading with contracts down 13 to 15 cents across most front months, pressured by an improving weather forecast and $6.63 losses in the...

Wheat Facing Monday Midday Losses
The wheat complex is falling back with the rest of the commodity complex on Monday. Chicago SRW contracts are 15 to 16 cents in the red. KC HRW futures...

Everyone Loves November Soybeans Right Now. History Doesn't!
Everyone sees the same soybean chart. Few will trade it the same way. Bulls see breakout fuel. Bears see harvest risk. When conviction cracks, opportunity...

Crude Oil Prices Sink on Hopes for US-Iran Diplomacy
September WTI crude oil (CLU26 ) on Monday closed down -6.70 (-7.50%), and September RBOB gasoline (RBU26 ) closed down -0.0820 (-2.52%). Crude oil and...
Forecasts for Near-Normal US Temps Undercut Nat-Gas Prices
August Nymex natural gas (NGQ26 ) on Monday closed down -0.104 (-3.62%). Nat-gas prices sank to a 2.5-month nearest-futures low on Monday and settled sharply...
Hazardous Heat in the Midwest Is Stoking Corn and Soybean Prices. What to Watch Next.
Bulls are getting a kick from hot and dry weather spreading across the U.S.
/A%20close-up%20of%20the%20Seagate%20sign%20on%20a%20corporate%20building%20by%20Sundry%20Photography%20via%20Adobe%20Stock.jpeg)
Wedbush Just Raised Its Price Target on Seagate Stock. Here's Why.
Wedbush analyst believes Seagate stock is not out of juice just yet. Here’s what could drive STX shares higher in the near-term.

Albertsons Stock Is Plunging After the Grocery Giant Slashed Its Outlook. Consumer Weakness Is to Blame.
Albertsons’ sharp guidance cut underscores how cautious consumers and intensifying price competition are creating fresh headwinds, creating a downturn....
/A%20photo%20of%20a%20corporate%20Qualcomm%20sign%20by%20JHVEPhoto%20via%20Adobe%20Stock.jpeg)
Qualcomm’s 36% Pullback Creates a Buying Opportunity Ahead of Q3 Earnings
Despite near-term challenges, Qualcomm's long-term outlook remains compelling. QCOM has evolved into a diversified leader in AI and semiconductors.

Slumping Crude Oil Prices Weigh on Sugar Prices
October NY world sugar #11 (SBV26 ) on Monday closed down -0.19 (-1.29%), and October London ICE white sugar #5 (SWV26 ) closed down -2.40 (-0.52%). Sugar...

Cocoa Prices Slump on Abundant Global Supplies
September ICE NY cocoa (CCU26 ) on Monday closed down -276 (-5.13%), and September ICE London cocoa #7 (CAU26 ) closed down -188 (-4.68%). Cocoa prices...