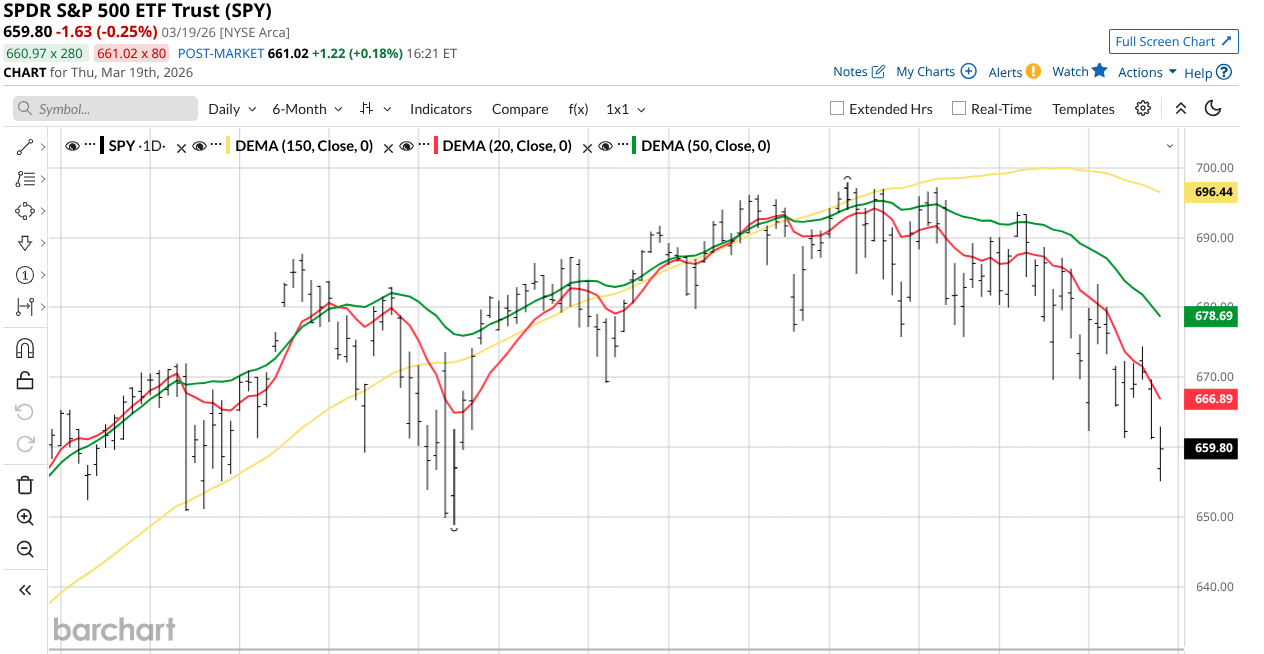
For 6 months, bulls and bears around the S&P 500 Index ($SPX) have battled to a near stalemate.
I’ve been tracking this very closely, in real time. Not only through my writing, but via my Reward Opportunity and Risk (ROAR) Score, a proprietary risk management tool that I created.
When we look at essentially the same chart as above, but using my ROAR tool, it tells a definitive, albeit not very exciting, story. The SPY ETF has been a bore for 6 months.
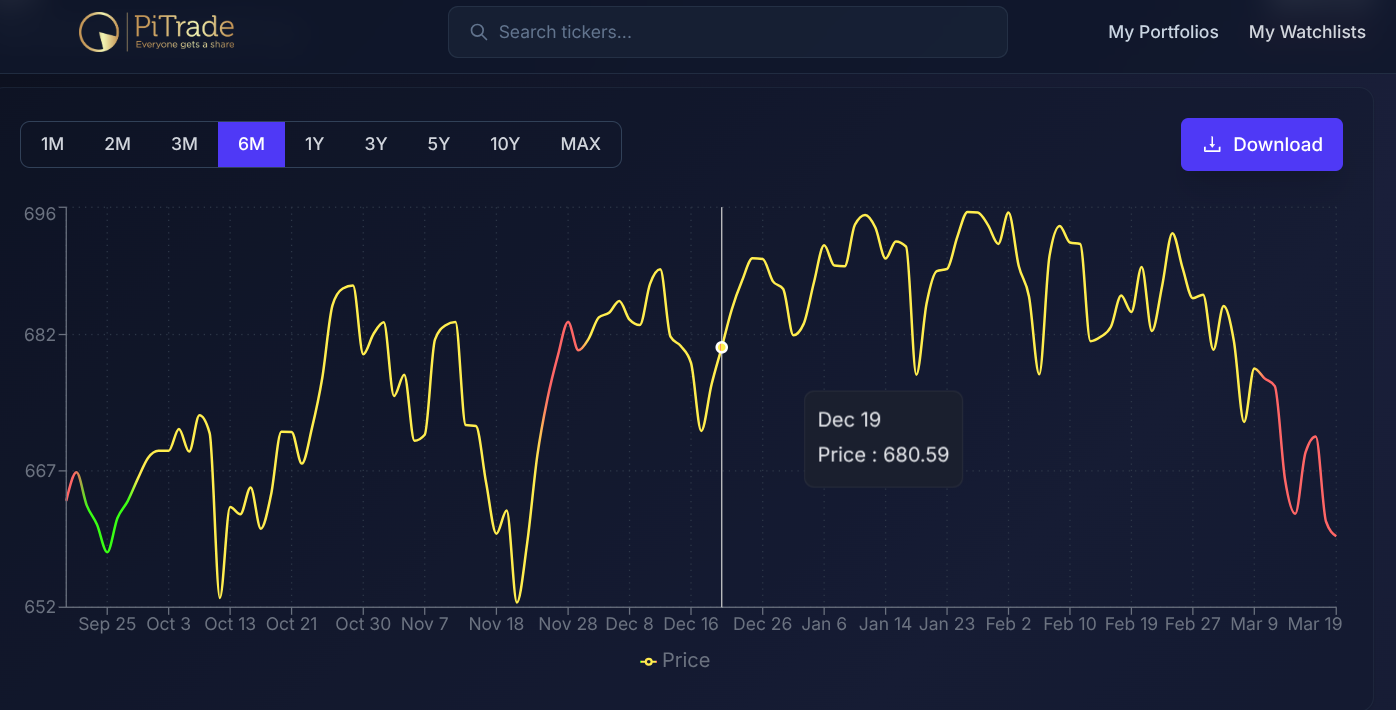
And now, as indicated by that red on the right above, it has entered high-risk territory. But that’s just the headline. The interesting stuff for traders and investors is underneath. And it is starting to look like a serious opportunity for the nimble.
I’d say “the brave,” but if someone tells you it takes bravery to profit from a down market, they are dismissing common sense. That’s what it takes. The sense to realize that no matter how much Wall Street tries to convince investors that making money in the stock market is a birthright, markets are CYCLICAL. And the cycle means it can fly in both directions, not only up.
So that headline index is a mask for a much more violent internal reality.
Beneath the surface, the breadth of the market has evaporated, leaving investors in a hollow era where the index remains relatively flat, but the majority of stocks are in a state of quiet or loud decay.
About one-fourth of the S&P 500 has been, like the index itself, within 5% of 0 in the year to date. But the market’s 500 biggest stocks have “wings” around that, with many up or down by 20%. More than one-fifth of the total S&P 500, in fact.
Only 35% of S&P 500 constituents are currently trading above their 50-day moving average. This indicates that the vast majority of stocks are failing to participate in the index’s attempts to find a floor. Buy the dip? So far, not so much.
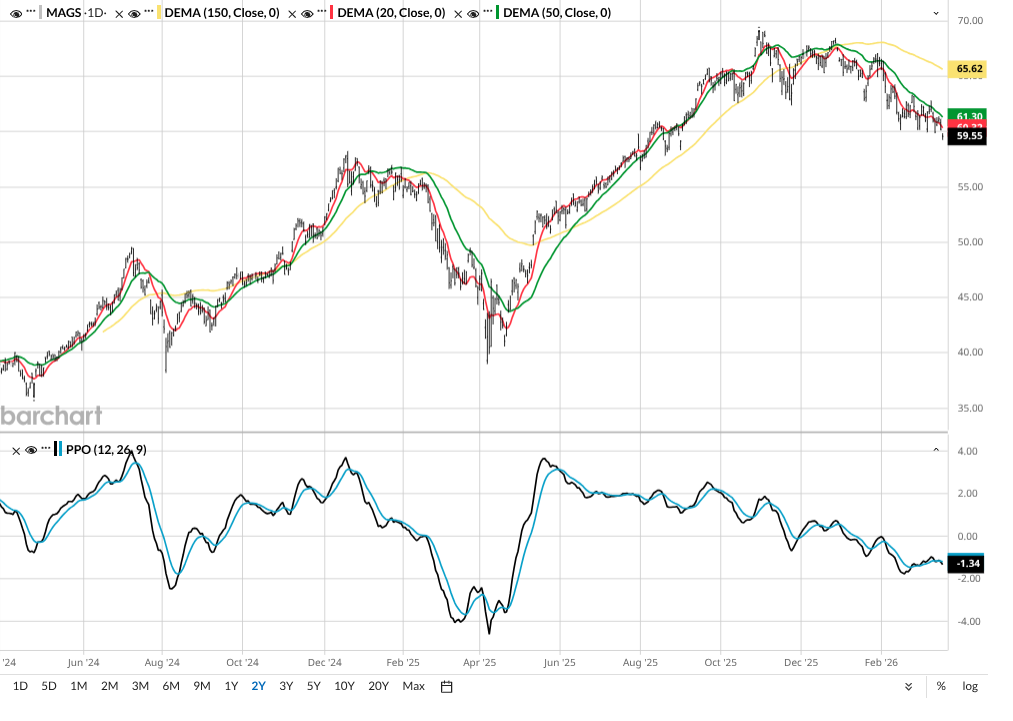
The concern from here is that high-growth-multiple tech leadership is reversing. Here’s the Roundhill Magnificent Seven ETF (MAGS), which is slipping off its former highs like an escalator. But there’s not much around to pick up the slack. Here and there, for days at a time maybe. But nothing that sticks. That smells like a bear to me.
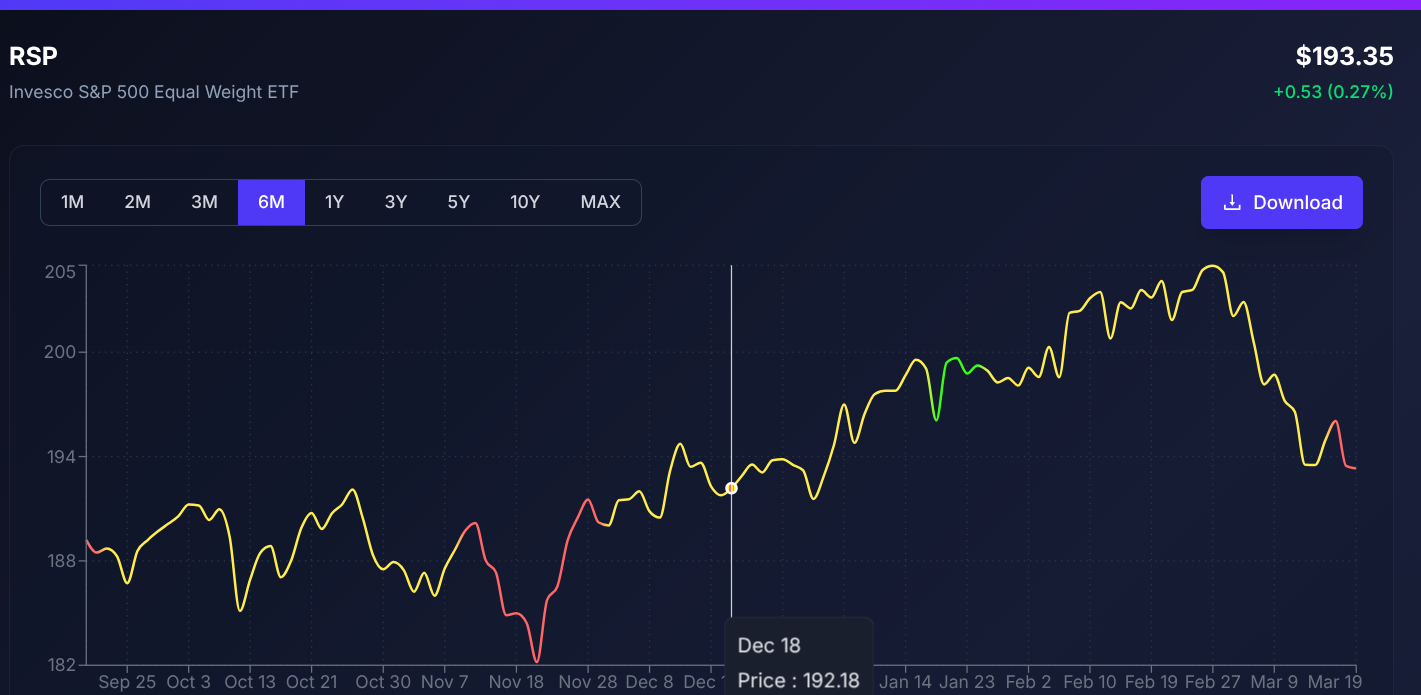
This extreme divergence confirms why broad-market exposure through the Invesco S&P 500 Equal Weight ETF (RSP) has become a no-alpha trap. While RSP gained some interest in February with record inflows, its long-term performance continues to underperform the cap-weighted SPY, as it captures the broad decay of the 493 other stocks that lack the institutional bedrock of the mega-cap leaders.
RSP took longer to turn from red to yellow. But it got there. And that makes the ditch the market has dug that much deeper.
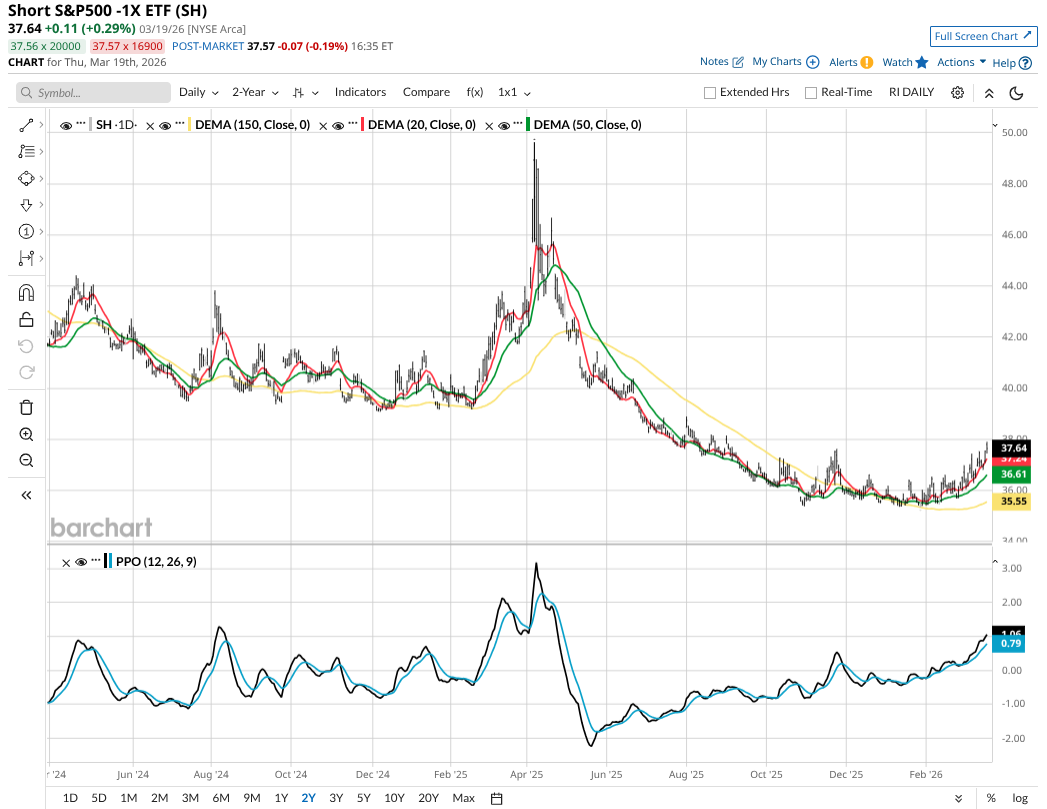
That’s why this chart below looks so good. It is the ProShares Short S&P 500 ETF (SH), which shorts the S&P 500. It’s the first place I look to hedge my stock exposure, when options are not the play. With volatility elevated, that limits some of my options work. So inverse ETFs like this one become a more important section of the wide toolbox I use to try to profit from down stock markets. Yes, you can actually do that!
The market has not just stalled. It has structurally changed. Investors who continue to treat the S&P 500 as a monolithic engine will likely find themselves holding the bag as the internal rot continues.
Rob Isbitts created the ROAR Score, based on his 40+ years of technical analysis experience. ROAR helps DIY investors manage risk and create their own portfolios. For Rob's written research, check out ETFYourself.com.
On the date of publication, Rob Isbitts did not have (either directly or indirectly) positions in any of the securities mentioned in this article. All information and data in this article is solely for informational purposes. For more information please view the Barchart Disclosure Policy here.
/Microsoft%20headquarters%20By%20Peter.jpeg)
/NVIDIA%20Corp%20logo%20outside%20building-by%20BING-JHEN_HONG%20via%20iStock.jpg)
/Micron%20Technology%20Inc_%20logo%20on%20building-by%20vzphotos%20vis%20iStock.jpg)
/Amazon%20-%20Image%20by%20bluestork%20via%20Shutterstock.jpg)
