S&P 500 Futures & Gold Analysis
The charts are key to this analysis.
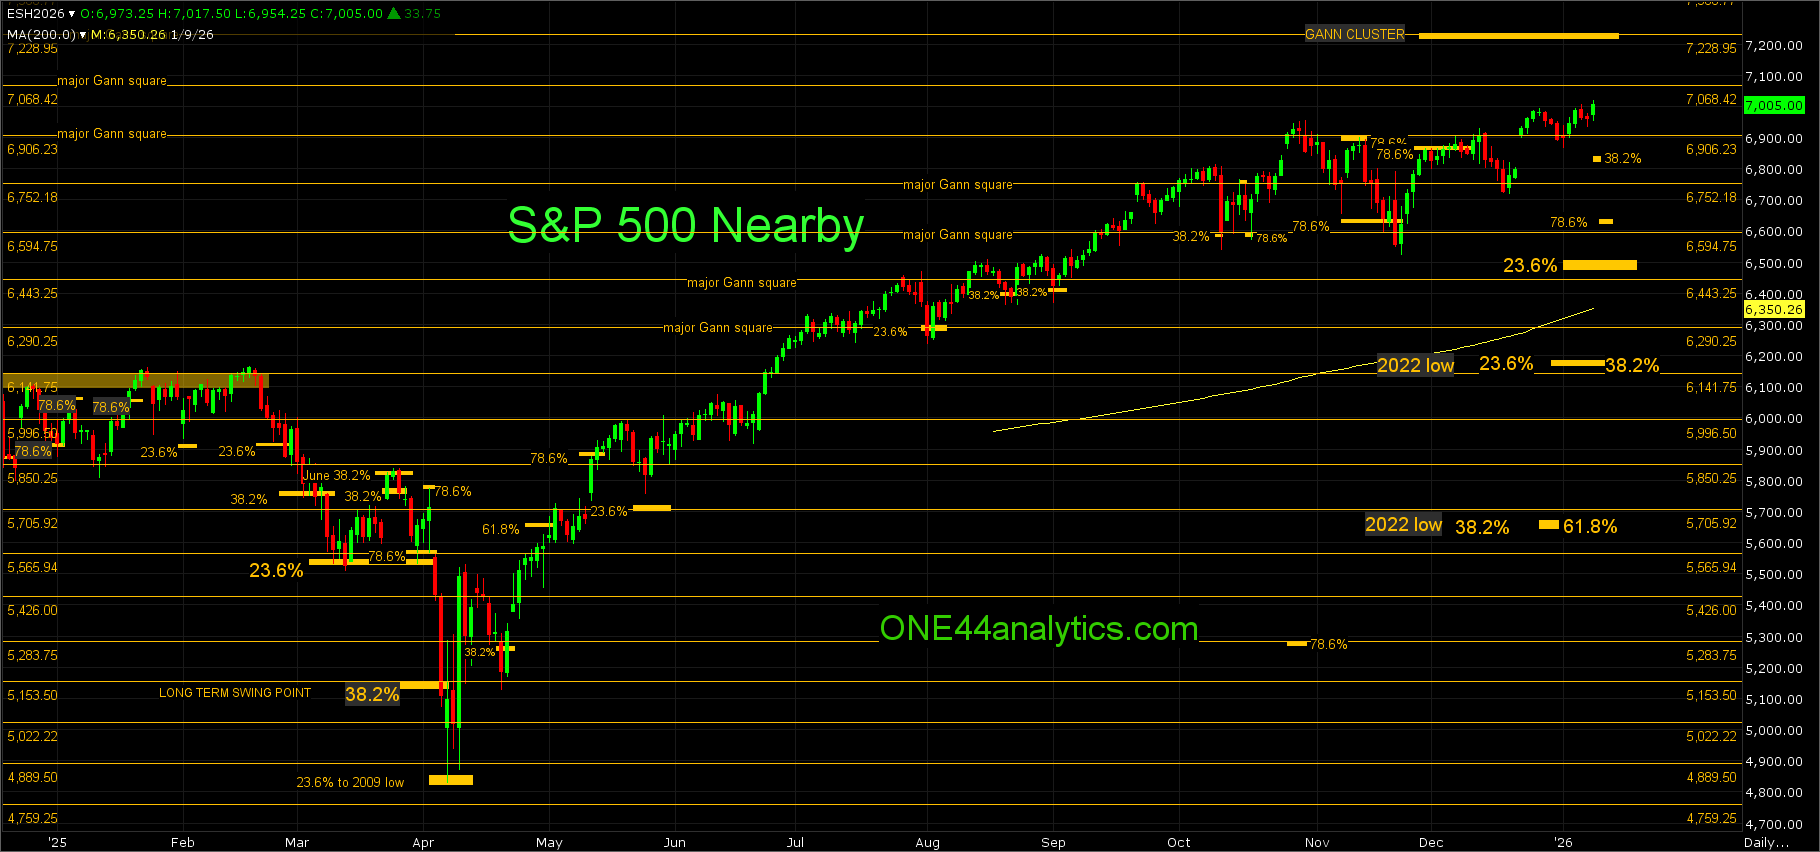
S&P 500 Futures
ESM26
The last two highs after the ATH was made on 1/28/26 were stopped by a 78.6% Fibonacci retracement, on 2/11/26 it was 6985.00 and then on 2/25/26 at 6966.00.
We know following the ONE44 78.6% rule that,
Any market that hits 78.6% should go 78.6% back the other way. This is also where a lot of Bull markets end and start.
When a market does react to 78.6% it usually creates wide swings that go through all the other retracements, this either happens in very large trading ranges or very small, it is also the level hit most often when the market is reacting from 23.6% and 38.2% and fails to make the new high/low. This is where a lot of Bull runs start and end.
The first setback from the 2/11/26 high hit 78.6% the other way on 2/17/26 at 6808.00 and that sent it 78.6% the other way again on 2/25/26 at 6966.00. We will now see if the break from 6966.00 (78.6%) will be the end of the Bull run for now. Friday's close was just below the 6752.00 major Gann square and this will be the key level for the week.
We have done over 45 videos on how to use the Fibonacci retracements with the ONE44 rules and guideline, this is our latest.
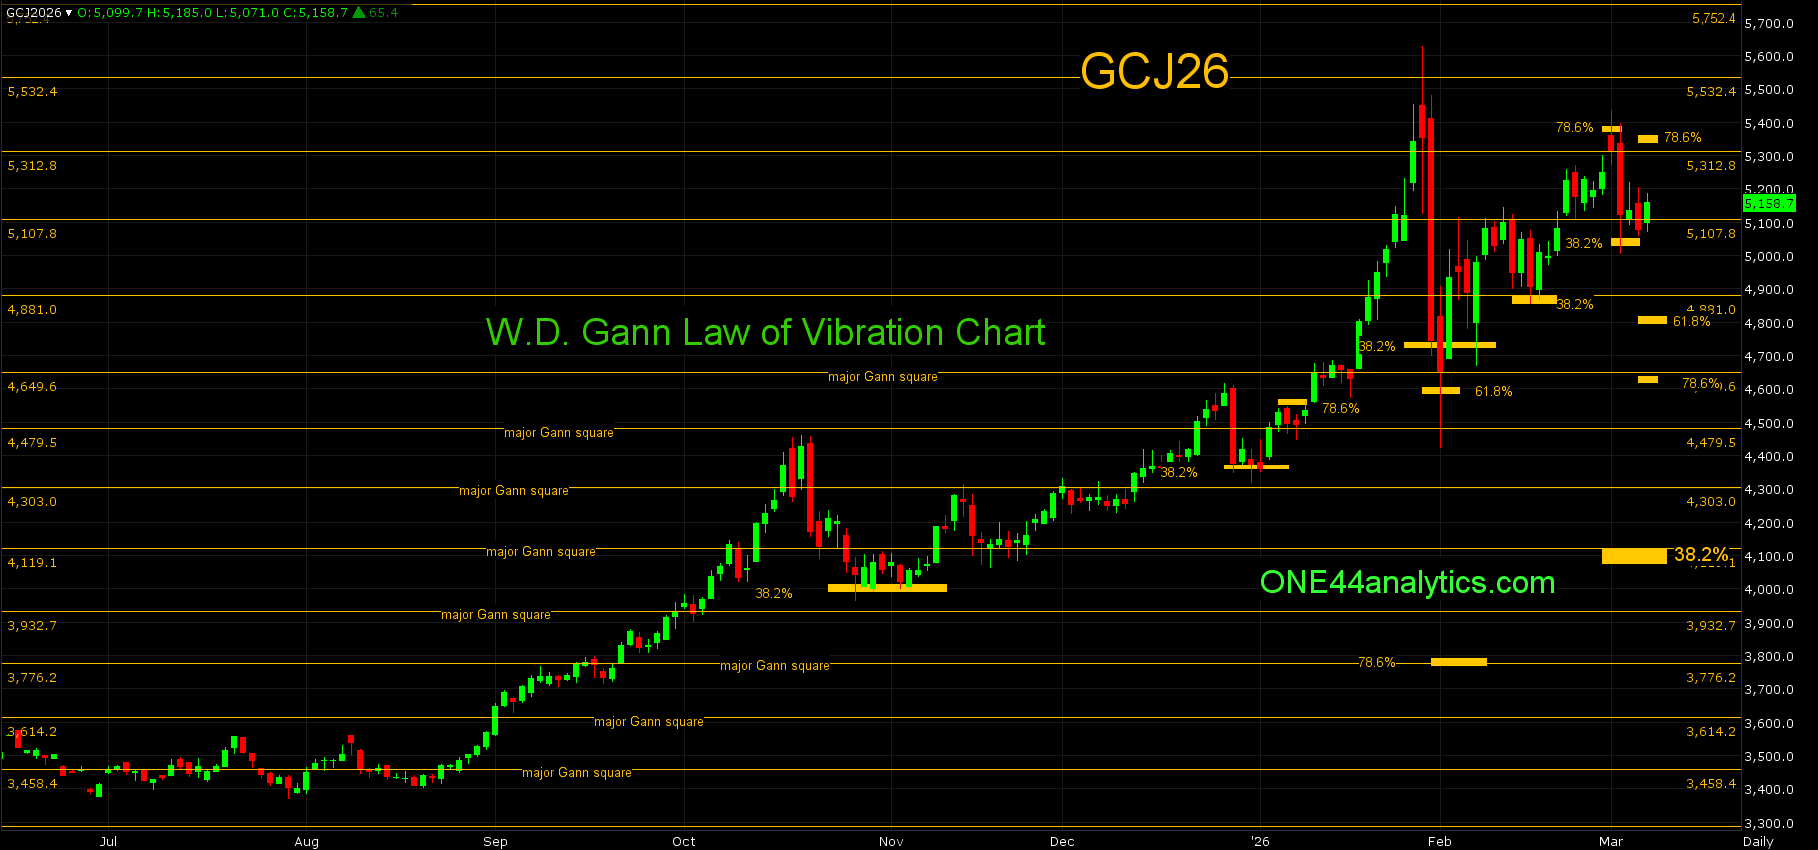
GOLD
Gold has continued to hold the 38.2% retracement on all the setbacks keeping the trend positive.
ONE44 38.2% rule,
The 38.2% retracement is the single most important one and is the level we use for the "Golden Rule". This rule being, " any market that is going to keep its current trend must hold 38.2%". As long as it does the trend will continue and it should make new highs/lows from that retracement.
A sub set of guidelines with the 38.2% level are for when the market fails to hold this level and when the reaction from it either fails to make a new high/low, or makes a slightly lower low/higher high and gets right back above the previous high/low.
On the failure to stop at 38.2% it tells us....
Even the late January plunge held 38.2% back to the 5/15/25 low at 4735.00, this was also 23.6% back to the 10/6/23 low. It did trade well below this level and had one close below it (we always want to see 2 to confirm the violation) and the next day was right back above it. On the rally from there it held 38.2% on 2/17/26 at 4881.00, which was also a major Gann square and the rally from there hit 78.6% back to the ATH at 5374.00. As we mention in the SP 500 update this is where a lot of Bull markets can end. The setback from 5374.00 has hit 38.2% back to the 2/2/26 low at 5052.00 and this will be the key level for the week.
To get the swing point for the week and the Above/Below levels you can click here.
ONE44 Analytics where the analysis is concise and to the point
Our goal is to not only give you actionable information, but to help you understand why we think this is happening based on pure price analysis with Fibonacci retracements, that we believe are the underlying structure of all markets and Gann squares.
If you like this type of analysis and trade the Grain/Livestock futures you can become a Premium Member.
You can also follow us on YouTube for more examples of how to use the Fibonacci retracements with the ONE44 rules and guidelines.
FULL RISK DISCLOSURE: Futures trading contains substantial risk and is not for every investor. An investor could potentially lose all or more than the initial investment. Commission Rule 4.41(b)(1)(I) hypothetical or simulated performance results have certain inherent limitations. Unlike an actual performance record, simulated results do not represent actual trading. Also, since the trades have not actually been executed, the results may have under- or over-compensated for the impact, if any, of certain market factors, such as lack of liquidity. Simulated trading programs in general are also subject to the fact that they are designed with the benefit of hindsight. No representation is being made that any account will or is likely to achieve profits or losses similar to those shown. Past performance is not necessarily indicative of future results.

/Micron%20Technology%20Inc_billboard-by%20Poetra_RH%20via%20Shutterstock.jpg)
/Qualcomm%2C%20Inc_%20logo%20on%20phone-by%20viewimage%20via%20Shutterstock.jpg)

/Abbott%20Laboratories%20vials%20and%20Logo-by%20Melniov%20Dmitriy%20via%20Shutterstock.jpg)