




Dual Edge Research publishes two powerful newsletters that work great individually — and even better together. The Bull Strangle Newsletter focuses on stocks and options, combining stock ownership with premium-selling strategies to generate consistent income and market-beating returns. The Smart Spreads Newsletter specializes in seasonal commodity futures spreads, offering a diversified approach with low correlation to equities. Together, they deliver a complete investment perspective — one focused on income, the other on diversification — all under one simple subscription.
Introduction
Over the past five articles, we’ve explored the major decisions involved in building a higher-probability commodity spread. We’ve examined:
- Whether history favors buying or selling.
- When seasonal opportunities have historically performed best.
- Which front-month contract cycle has produced the strongest results?
- Whether a two-leg or three-leg structure has historically offered the better balance of return and risk.
- And how today’s forward curve can either reinforce—or weaken—a historical opportunity.
Each article focused on a single research question. This week, we’ll put those pieces together and show how they form one objective screening process.
The Problem Isn’t Finding Trades
Many traders assume the greatest challenge is discovering seasonal opportunities. In reality, the opposite is often true. There are an enormous number of possible commodity spreads. Across multiple markets, delivery months, directions, spread structures, and entry dates, the number of potential combinations quickly grows into the hundreds of thousands.
The challenge isn’t finding trades. It’s identifying which of those opportunities have historically demonstrated the strongest combination of profitability, consistency, and risk.
That requires a disciplined process of elimination.
From 500,000 Possibilities to a Focused Watchlist
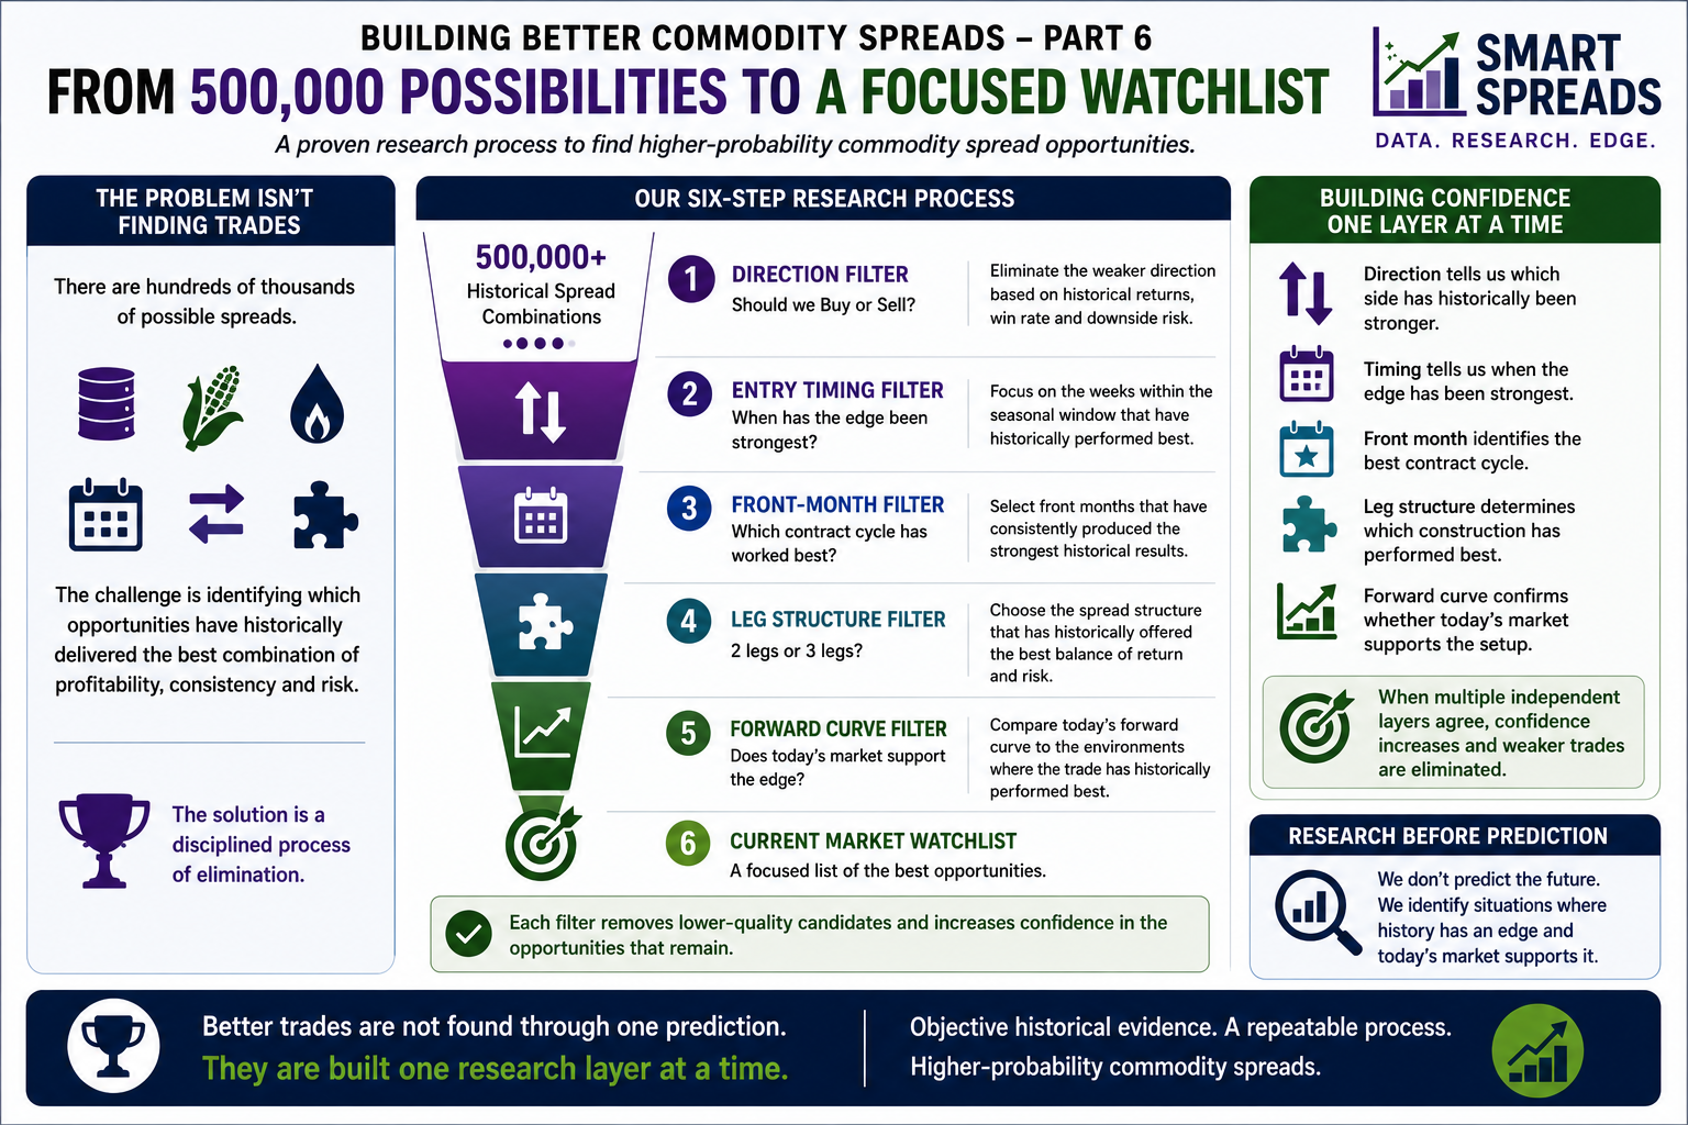
The Smart Spreads research process begins with more than 500,000 historical spread combinations. Rather than searching for one perfect indicator, we narrow that universe one decision at a time. The process looks like this:
500,000+ Historical Spread Combinations
↓
Direction Filter
↓
Entry Timing Filter
↓
Front-Month Filter
↓
Leg Structure Filter
↓
Forward Curve Filter
↓
Current Market Watchlist
Each filter answers a different question. Each removes lower-quality candidates. And each increases confidence in the remaining opportunities.
Direction: Should We Buy or Sell?
The first decision is direction. Does history favor buying or selling spreads in this market? In some commodities, BUY spreads have historically produced the stronger results. In others, SELL spreads have delivered higher average returns, better win rates, or fewer large losses.
If one direction consistently demonstrates a stronger historical profile, the weaker alternative can be removed early in the process. This immediately reduces the number of candidates requiring further analysis.
Entry Timing: When Has the Edge Been Strongest?
Once the preferred direction has been identified, the next question is timing. Seasonality may identify a broad opportunity window, but not every week within that window has historically performed equally well. Some entry weeks have produced stronger average returns. Others have delivered higher win rates or lower downside risk. By evaluating entry timing independently, the research focuses on the periods when the historical edge has been most reliable.
Front-Month Selection: Which Contract Cycle?
The next filter evaluates the front month. Even when the market direction, structure, and entry week are the same, different front-month contracts can produce dramatically different historical results.
Recurring forces such as production cycles, harvest schedules, inventories, storage economics, and commercial hedging activity can affect each contract cycle differently. Front-month analysis helps identify which expiration months have historically produced the strongest opportunities before individual spread combinations are evaluated in greater detail.
Leg Structure: Two Legs or Three?
Next, we evaluate the structure of the spread. Should the position contain two contracts or three? Traditional two-leg calendar spreads remain effective in many markets. But in others, three-leg spreads have historically produced higher returns, stronger win rates, fewer large losses, or more consistent performance.
The preferred structure varies by market. Rather than assuming one approach is always better, the data determines whether two legs or three legs have historically provided the stronger combination of return and risk.
Forward Curve: Does Today’s Market Support the Edge?
The first four filters rely primarily on historical performance. The forward curve brings current market conditions into the process. A seasonal opportunity may have an excellent long-term record, but today’s supply, demand, inventory, and storage environment may differ from the conditions under which that trade performed best.
By measuring the forward curve when each historical trade was opened, we can evaluate how similar trades performed under different market structures. That allows us to ask one final question:
- Does today’s market resemble the environments where this opportunity has historically been most successful?
Historical seasonality identifies the opportunity. Forward-curve analysis helps determine whether today’s market supports it.
Building Confidence One Layer at a Time
The value of this process does not come from any single filter. It comes from combining multiple independent sources of evidence. Direction tells us which side has historically been stronger. Timing tells us when the edge has been strongest. Front-month analysis identifies the best contract cycle. Leg structure determines which construction has historically performed best. Forward-curve analysis confirms whether today’s market environment supports the opportunity.
When several independent layers agree, confidence in the remaining candidates increases. More importantly, weaker trades are removed before they ever reach the watchlist.
Research Before Prediction
One of the biggest misconceptions about seasonal trading is that success depends on predicting what the market will do next. Our research suggests a different objective. The goal is not to predict the future with certainty.
The goal is to identify situations in which history has repeatedly demonstrated favorable characteristics and in which today’s market structure continues to support those conditions. That distinction changes the entire research process. Instead of beginning with a market opinion and searching for evidence to support it, the process begins with the data. The trade must earn its way through each filter.
A Repeatable Process
This methodology creates a disciplined and repeatable framework for evaluating commodity spreads. It reduces the temptation to select trades based on a single attractive chart, a strong seasonal average, or a recent market move. Every candidate is evaluated using the same sequence of questions:
- Is the direction historically favorable?
- Is the entry timing attractive?
- Is the front month historically strong?
- Is the leg structure appropriate?
- Does today’s forward curve support the setup?
Only after those questions are answered does a trade become a serious watchlist candidate.
Final Thoughts
Commodity spread trading offers nearly unlimited possibilities. The challenge is not finding another trade. The challenge is identifying which opportunities deserve attention. By starting with more than 500,000 historical spread combinations and systematically applying direction, timing, front-month, leg-structure, and forward-curve filters, the Smart Spreads research process narrows an enormous universe into a focused current-market watchlist.
No research process can eliminate risk or guarantee future results. But objective historical evidence can help traders avoid many lower-quality opportunities and focus on the spreads that have historically offered the strongest combination of returns, consistency, and risk. That is the central idea behind the Building Better Commodity Spreads series:
- Better trades are not found with a single prediction. They are built one research layer at a time.
Past Articles in the Series
Part 1: Why Direction Isn't Enough
Part 2: Timing Is More Than a Calendar
Part 3: Why the Front Month Matters
Part 4: Why Three Legs Can Be Better Than Two
Part 5: Why Forward Curves Matter
Additional Details
The Bull Strangle Newsletter focuses on stocks and options, combining stock ownership with disciplined option-selling techniques designed to generate consistent income while managing risk.
The Smart Spreads Newsletter focuses on seasonal commodity spreads, a historically proven approach that seeks opportunities across agricultural, energy, metal, and financial futures markets.
Each strategy is designed to stand on its own, but together they provide a diversified approach that can perform across a wide range of market environments. For traders looking to deepen their education, The Bull Strangle Strategy and Trading Commodity Spreads, both available on Amazon.
Visit BullStrangle.com to subscribe for just $1 for the first month.
For a video overview of the Bull Strangle Newsletter
For a video overview of the Smart Spreads Newsletter
Darren Carlat
Dual Edge Research
(214) 636-3133
DualEdgeResearch@gmail.com
Disclaimer
This information is for informational purposes only and should not be considered as investment advice. Past performance is not indicative of future results, and all investments carry inherent risk. Consult with a financial advisor before making any investment decisions.


/A%20close-up%20of%20an%20AMD%20office%20by%20gehapromo%20via%20Adobe%20Stock.jpeg)
/Space/Rocket%20launching%20into%20space%20by%20BEST%20BACKGROUNDS%20via%20Shutterstock.jpg)
/Applied%20Materials%20Inc_%20campus%20sign-by%20Sundry%20Photography%20via%20iStock.jpg)
