




Grain Report Chart of the Day
A nice setup in this index chart of sorts.
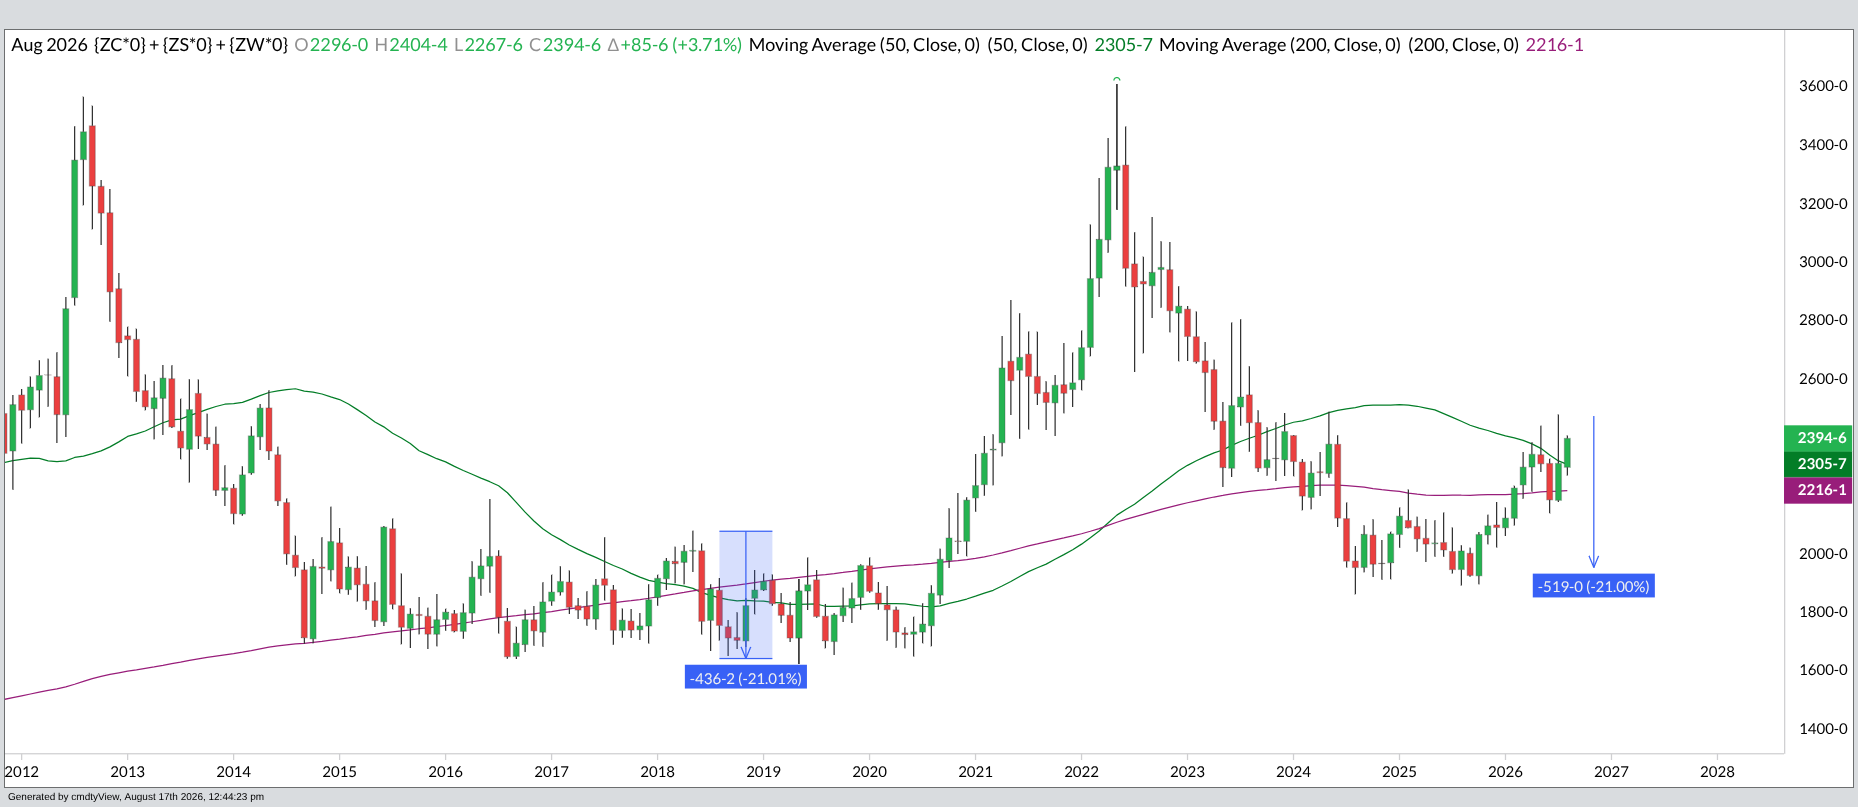
Compare today's chart to the one from 2018.
Now, this isn't quite a fractal, per se, but take a look at the relationship between the green 50-week moving average and the purple 200-week.
Notice how the chart dropped 20% as the 50 crossed below the 200?
Now the cross appears inevitable.
The question is: will the price respond similarly to 2018?
Join 3,500+ farmers getting sell signals and technical roadmaps here:
Trent Klarenbach, BSA AgEc, PAg, publishes the Klarenbach Grain Report, Klarenbach Special Crops Report, The Daily Board and The Daily Kernel newsletters.
Klarenbach Research
Sign up below for a FREE trial of our newsletters


/Alphabet%20(Google)%20Image%20by%20Markus%20Mainka%20via%20Shutterstock.jpg)
/Netflix%20on%20tv%20with%20remote%20by%20freestocks%20via%20Unsplash.jpg)

