Soybean Target Hit at 1148.00, What's Next?
This is an update to a previous post titled,
The Break In Soybeans From 61.8% (1154.00) And The 1148.25 Major Gann Square Continues, Here Is Our Target.
The Soybeans completed the 61.8% (1154.00) to 61.8% (1048.00) per the ONE44 61.8% rule.
Here is what to look for now.
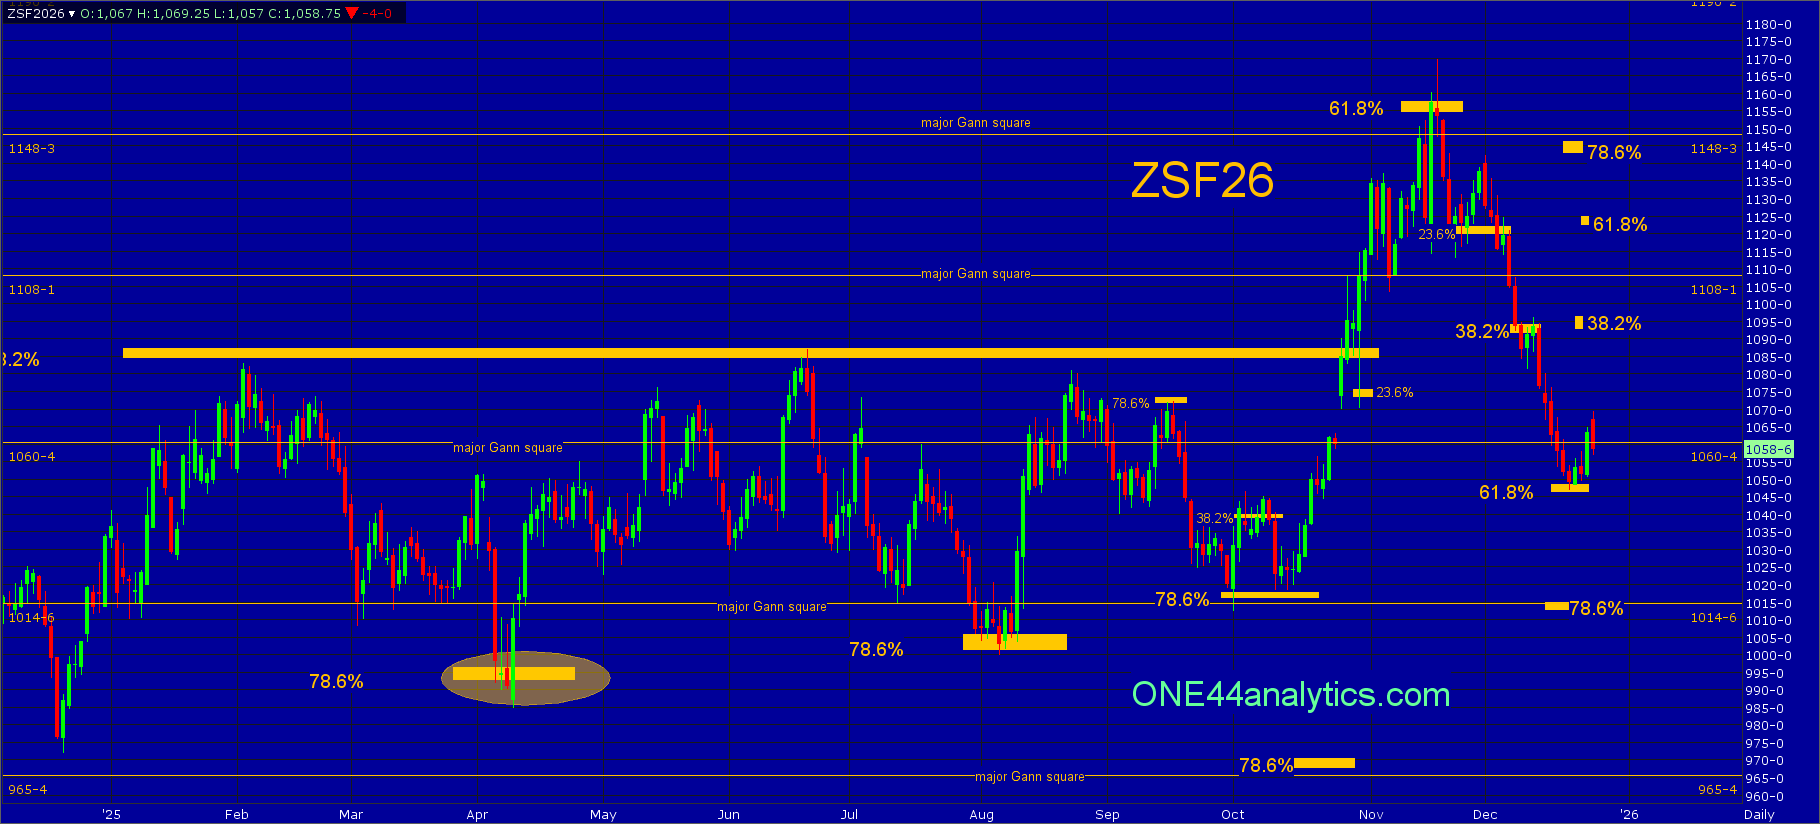
Soybeans
This will be the last update for January.
From last week.
The market never got back above the 1122.00 (23.6%) swing point for the week and it hit the short term target of 38.2% at 1094.00. It had one solid close below it and had no follow through on the downside, 1094.00 is the short term swing point and it needs to get right back above it to keep the trend positive, this will be the key level for the week. A failure to do so can send it down to complete the 61.8% (1154.00) to 61.8% the other way per the ONE44 61.8% rule.
Use 1094.00 as the swing point for the week.
Below it, look for a completion of the 61.8% (1154.00) to 61.8% back the other way at 1048.00 based on the ONE44 61.8% rule. The long term....
The market could not get back above 1094.00 (38.2%) swing point for the week. It fell just short of completing the 61.8% (1154.00) to 61.8% target of 1048.00 and this will be the key level for the week. We will use the ONE44 61.8% rule to get the longer term upside target of 61.8% the other way.
Use 1048.00 as the swing point for the week.
Above it, per the ONE44 61.8% rule we will be looking for 61.8% back to the 11/18/25 high at 1125.00. The short term target is 38.2% of the same move at 1096.00, if this is all it can rally it keeps the short term trend negative and a new low can quickly follow. The long term target area is 78.6% at 1144.00 and the 1148.25 major Gann square.
Below it, you still have to watch for a trade down to 1048.00 and a close back above the 1060.50 major Gann square, as this can cause a sharp rally, if this does happen it will lower the retracements above. The short term target level is 1014.75, this is 78.6% back to the 12/19/24 low and a major Gann square. A failure to turn back up from this area will give us only major Gann squares to look for support and then use as the swing point when closed below, the next one is 965.50.
ONE44 Analytics where the analysis is concise and to the point
Our goal is to not only give you actionable information, but to help you understand why we think this is happening based on pure price analysis with Fibonacci retracements, that we believe are the underlying structure of all markets and Gann squares.
If you like this type of analysis and trade the Grain/Livestock futures you can become a Premium Member.
You can also follow us on YouTube for more examples of how to use the Fibonacci retracements with the ONE44 rules and guidelines.
Sign up for our Free newsletter here.
FULL RISK DISCLOSURE: Futures trading contains substantial risk and is not for every investor. An investor could potentially lose all or more than the initial investment. Commission Rule 4.41(b)(1)(I) hypothetical or simulated performance results have certain inherent limitations. Unlike an actual performance record, simulated results do not represent actual trading. Also, since the trades have not actually been executed, the results may have under- or over-compensated for the impact, if any, of certain market factors, such as lack of liquidity. Simulated trading programs in general are also subject to the fact that they are designed with the benefit of hindsight. No representation is being made that any account will or is likely to achieve profits or losses similar to those shown. Past performance is not necessarily indicative of future results.

/Super%20Micro%20Computer%20Inc%20logo%20on%20building-by%20Poetra_RH%20via%20Shutterstock.jpg)