I explained why the dollar index was stuck in neutral in a November 4 Barchart article. I concluded the article with the following:
The dollar index is stuck in neutral in early November 2025, but it is consolidating near the low end of its recent trading range. The odds currently favor a continuation of the lower lows and lower highs and bearish trend in place since the high in early 2025.
While the next significant move in the index is a coin toss, the odds remain tilted to the downside.
The dollar index remains in a neutral trend
The dollar index continues to trade in a sideways pattern in late 2025.
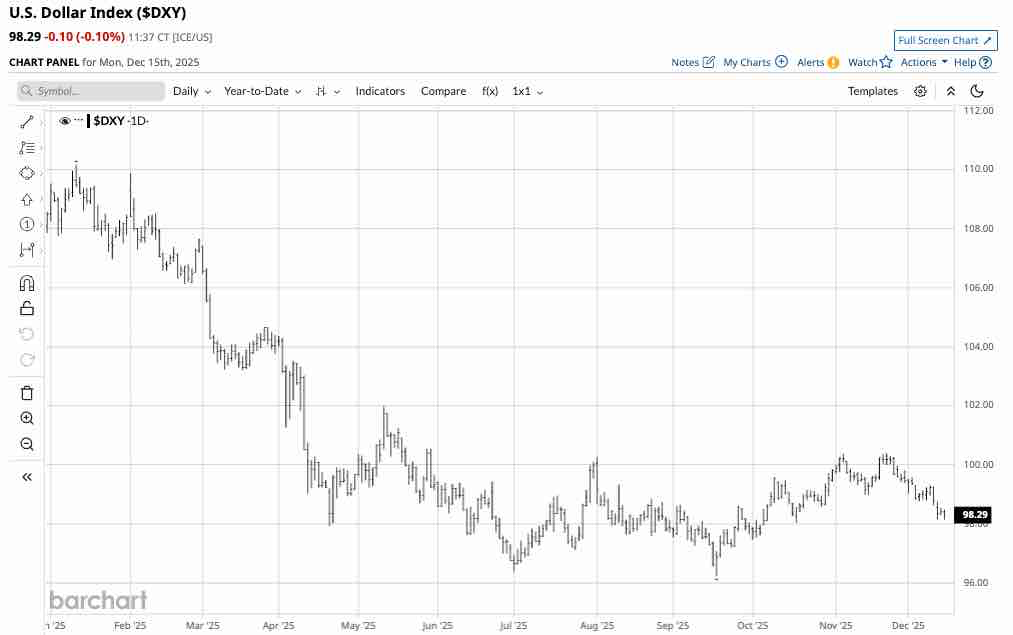
The year-to-date dollar index chart shows the index has traded around the 100 pivot point since mid-April 2025, remaining primarily below since late May. In mid-December, the index was trading just below the 98.30 level and was within the trading range.
Three reasons why the Fed Funds Rate will decline in 2026
The U.S. Federal Reserve reduced the short-term Fed Funds Rate by 25 basis points for the third time in 2025 at the final December FOMC meeting. The rate is now at a midpoint of 3.625% going into 2026. The three factors that will likely lead to further rate cuts this coming year are:
- U.S. President Donald Trump favors lower interest rates, and will appoint a replacement for current Chairman Jerome Powell during the first half of 2026. The replacement will likely favor a more dovish monetary policy approach, sending the short-term Fed Funds Rate lower in 2026.
- Inflation remains stable around 3%, which could encourage the central bank to push short-term rates towards 3%. Further declines in inflation indicators could drive the Fed Funds Rate even lower.
- Unemployment data has been increasing, favoring lower interest rates over the coming months.
While the Fed controls short-term interest rates, longer-term rates are determined by buying and selling in the U.S. government Treasury bond market. Therefore, lower short-term interest rates do not guarantee falling long-term interest rates.
Meanwhile, one of the primary factors influencing the path of least resistance against the other world reserve currencies is interest rate differentials. The euro is the dominant reserve foreign-exchange instrument in the U.S. dollar index, comprising 57.6% of the index. The current euro short-term rate is 1.93%. A decline in U.S. dollar interest rates favors a lower U.S. dollar index due to a narrowing rate differential.
The dollar index’s technical picture in late 2025
The long-term chart of the dollar index highlights conflicting trends.
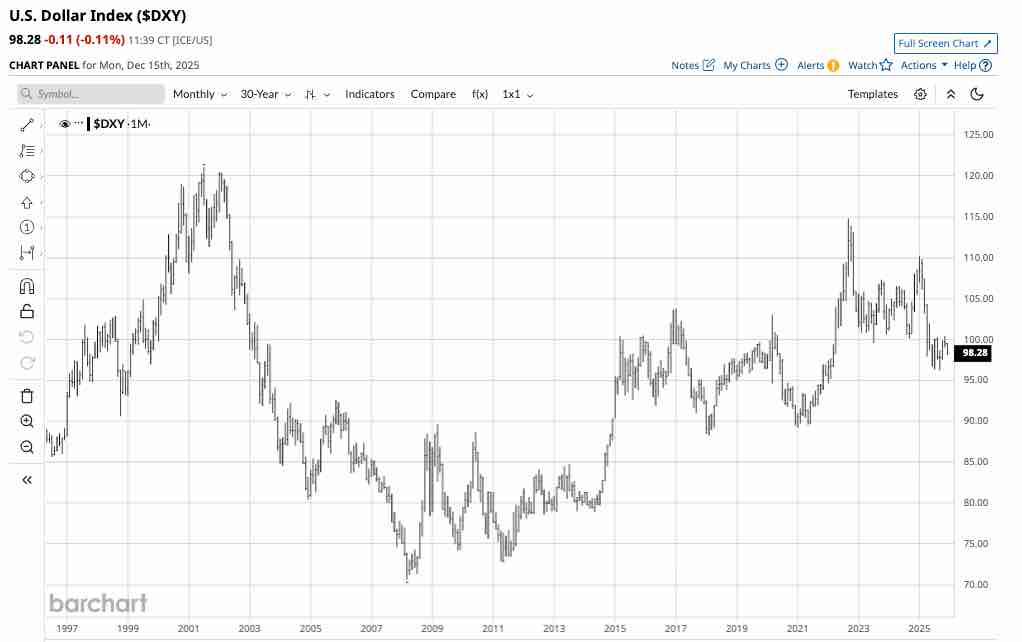
The 30-year monthly chart shows that while the dollar index has made a lower high than the 2001 peak in 2008, the index has made higher lows and highs from 2008 through 2022. However, the index rose to a lower high in January 2025 and has formed lower highs and lower lows throughout this year. Critical technical resistance now stands at the January 2021 low of 89.20, nearly ten points below the current level.
The factors that could derail a decline or keep the index stable
The dollar remains the world’s leading fiat currency due to political and economic stability in the United States. Therefore, unexpected events in the geopolitical or economic landscapes have historically supported the U.S. dollar index as the dollar’s value tends to rise during tumultuous periods. Wars, natural disasters, and financial woes have been bullish for the U.S. currency for decades. The latest examples were U.S. dollar rallies during the 2020 global pandemic and in 2022 when Russia invaded Ukraine. Any unexpected events that shock markets across all asset classes could cause a sudden rebound in the dollar index.
I reiterate a buy on the UDN ETF- Limited downside risk at the current level
While unexpected events could cause the dollar index to rally from below the 100 level toward the first technical resistance at the January 2025 high of 110.17, the case for a continuation of lower lows remains compelling as markets head into 2026.
In 2025, the dollar index fell 12.66% from the January high to the most recent September low of 96.22. The Invesco DB U.S. Dollar Index Bearish -1X Fund (UDN) is an unleveraged ETF that rises when the U.S. dollar index declines.
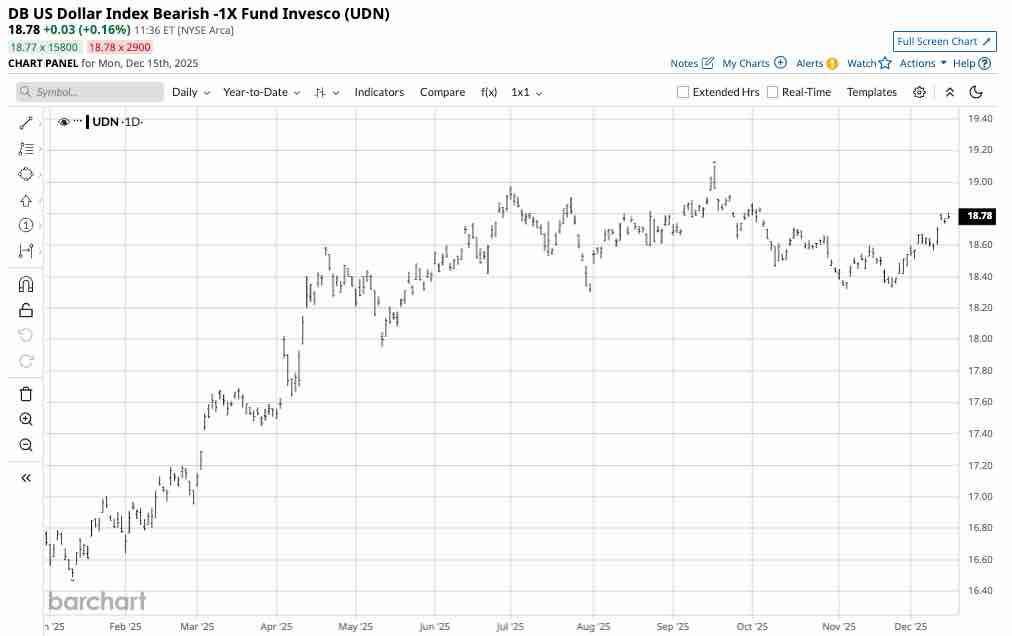
UDN’s year-to-date chart highlights the 15.89% rise from the January 2025 low of $16.49 to the September 2025 high of $19.11 per share. UDN does an excellent job tracking the dollar index’s downside price action and has outperformed the index on the downside in 2025.
At $18.78 per share on December 15, 2025, UDN remains in a trading range, tracking the U.S. dollar index. UDN had nearly $153.75 million in assets under management and trades an average of 132,400 shares per day. UDN is a liquid bearish dollar index ETF that charges a 0.77% management fee.
I remain bearish on the dollar index in late 2025, expecting lower lows to continue in 2026. The first downside technical target is just below the 90 level, leaving plenty of downside room over the coming weeks and months.
On the date of publication, Andrew Hecht did not have (either directly or indirectly) positions in any of the securities mentioned in this article. All information and data in this article is solely for informational purposes. For more information please view the Barchart Disclosure Policy here.

/Oracle%20Corp_%20office%20logo-by%20Mesut%20Dogan%20via%20iStock.jpg)


/Boeing%20Co_%20sign%20at%20airport-by%20sanfel%20via%20iStock.jpg)