
The big news on Wednesday was the Federal Reserve's 0.25% cut in its key federal funds rate to a range of 3.5%-3.75%. Projections suggest only one 0.25% interest rate cut will happen in 2026 due to slowing job growth and persistent inflation.
Despite the realization that interest rates aren’t going to get much lower, stocks jumped on the news; the S&P 500 and Nasdaq 100 indexes hit six-week and five-week highs, respectively.
In yesterday’s unusual options activity, the top 25 ETF put options by Vol/OI (volume-to-open-interest) ratios ranged from a high of 216.48 for the iShares 7-10 Year Treasury Bond ETF (IEF) to 8.62 for the iShares Russell 2000 ETF (IWM).
Small-cap stocks have had a strong run recently. On Nov. 21, IWM’s performance took off relative to the SPDR S&P 500 ETF (SPY), up 8.15% since then and 88% higher than SPY over the same period.
IWM had three unusually active put options on Wednesday with Vol/OI ratios above 10. Despite IWM’s bearish 2.44 put/call OI ratio, one of the three puts screams Covered Strangle.
Here’s why.
The IWM Puts in Question

As you can see from above, all three puts had reasonably high volume yesterday, most notably, the Jan. 16/2026 $243 strike, at 57,033, 14.02 times the open interest.
Before getting into the merits of each of these puts for a covered strangle, let’s consider what this options strategy is all about.
The covered strangle combines two option strategies: a Covered Call and a Cash-Secured Put. Using IWM as an example, you already own or buy 100 shares of the ETF, sell one call short and sell one put short for premium income. Both options have the same expiration date.
Income generation isn’t the sole driver of this strategy; I see it as something much more important.
“Covered strangles aren't just about collecting premiums, however; they can also be a systematic way to manage exposure to the underlying. If the underlying falls, assignment on the put can increase long exposure at lower prices; if it rises, assignment on the call can trim exposure and realize gains,” Charles Schwab’s guide to covered strangles states.
“Essentially, traders can earn income while effectively setting predetermined points at which they'd be comfortable selling or buying the shares.”
There’s been a lot of talk lately about investors using a buy-on-the-dip strategy to get good entry points for stocks they want to own. One of many tactical investing strategies investors can use, the data Barron’s cites suggests that buy-on-the-dip doesn’t outperform over time.
That’s where covered strangles come in.
If you are trying to buy stocks that you already own at a lower entry point -- say 20% OTM (out of the money) -- the cash-secured put pays you to do that. The covered call pays you to set a sell point on the upside. I like 20% on the downside and 50% on the upside. However, most investors will find the income generated not worth the effort. I would disagree.
Now let’s consider all three puts as the foundation for a covered strangle. One of them stands out as the better bet.
The Highest Premium

The bid price of the Jan. 9/2026 put is $4.18. That would generate an annualized return of 20.5% [$4.18 bid price / $252 strike price - $4.18 bid price * 365 / 30]. While that’s an attractive return, the likelihood that the share price will be above the $247.82 breakeven at expiration is 68.9%, so it’s not guaranteed.
But for now, let’s look at the upside and an appropriate covered call. The Jan. 9/2026 $290 call is 13.81% OTM with a 13.9% annualized return and 50.3% chance of being above the $254.70 breakeven. Given the expected move of $9.61, the upper price of $264.42 is above the breakeven and below the $290 strike, so you would pocket the premium and would not be forced to sell your 100 IWM shares.
The Highest Volume

I’m always intrigued by a high Vol/OI ratio with significant volume. Often, you’ll see high Vol/OI ratios with really low open interest. That’s not the case here. The bid price of $2.41 on the Jan. 16 $243 put offers a reasonable annualized return of 9.9% while providing a larger margin of safety with a $240.59 breakeven.
Naturally, the profit probability is nearly 10 percentage points higher at 79.40%. Further, the 37-day DTE (days to expiration) is appropriate for the covered strangle, halfway between 30 and 45 days, the ideal timeframe for this strategy to play out.
The expected move to Jan. 16 is $11, or 4.32%, with an upper price of $265.81. Let’s look for a call strike price further OTM. Today’s trading suggests the $300 strike is the best bet.
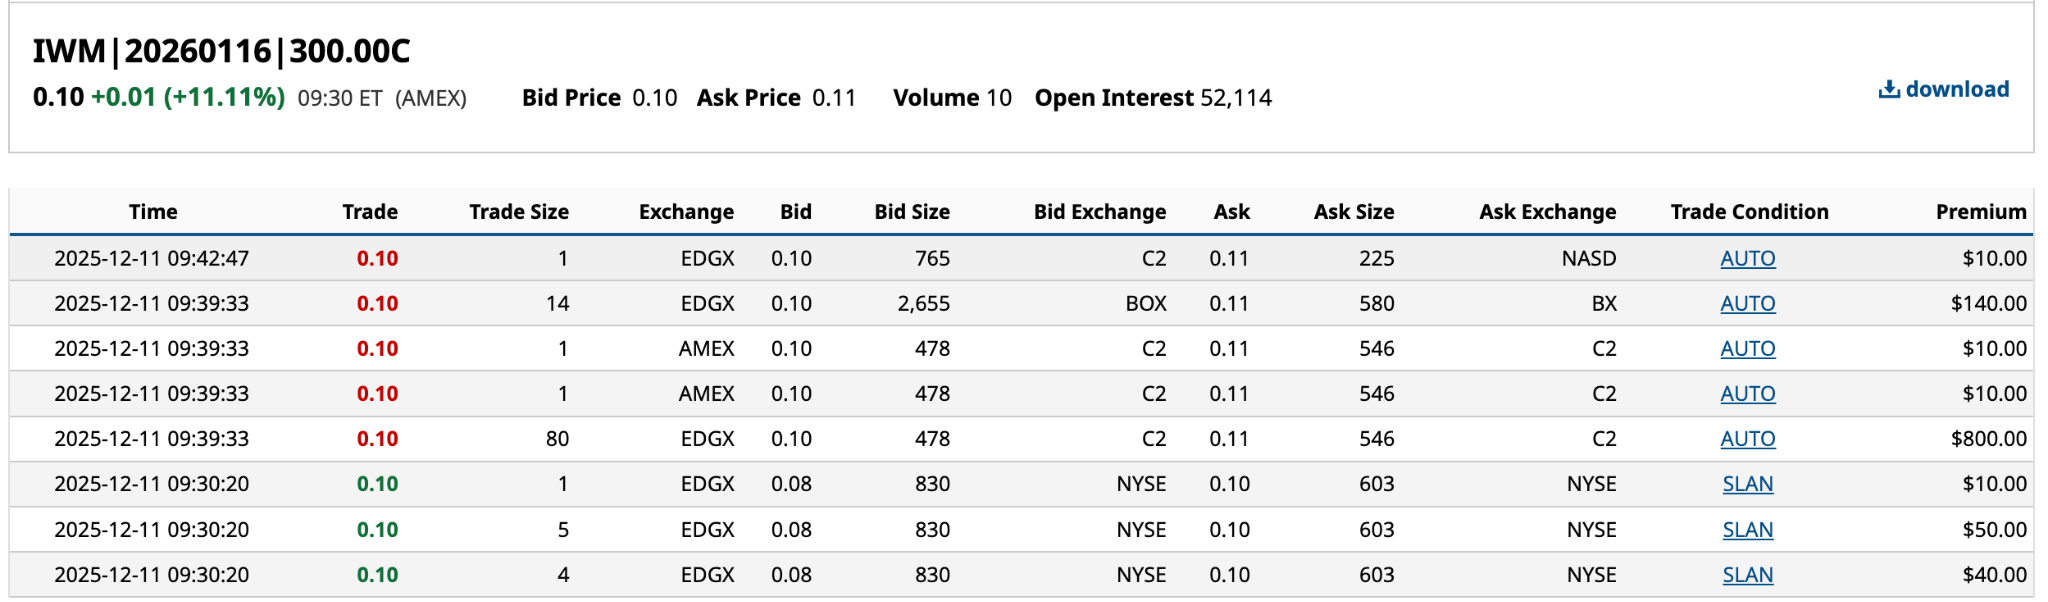
As you can see, we’ve got 107 contracts traded with bid prices between $0.08 and $0.10. The $0.10 bid provides an annualized return of 0.30% [$0.10 bid price / $300 strike price - $0.10 bid price * 365 / 36].
The Highest Vol/OI Ratio

The Dec. 26 $233 put expires the day after Christmas. The 31.26 Vol/OI ratio was the third-highest among ETF puts yesterday. While its 2.4% annualized return isn’t much to write home about, the $232.76 breakeven price provides a potentially good entry point given IWM’s momentum. The quarter-point rate cut should help smaller companies. We’ll see in 2026.
However, the covered call component of the covered strangle strategy offers limited flexibility. The highest strike price with volume, as I write this on Thursday morning, is $267.
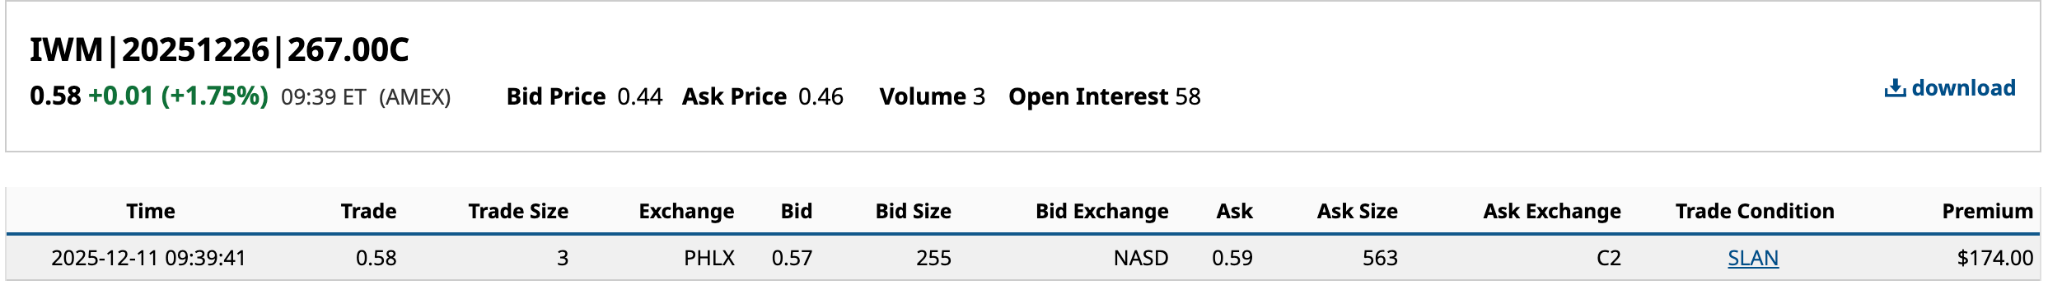 The bid price of $0.57 is an annualized return of 4.79% [$0.57 bid price / $267 strike price - $0.57 bid price * 365 / 16]. That’s more than acceptable. Further, the expected move of $6.78 results in an upper price of $261.16, below the $267 strike price, so you wouldn’t be forced to sell your shares.
The premium income for the Jan. 9/2026 $252 put is $4.29, $2.51 for the Jan. 16/2026 $243 put, and $0.81 for the Dec. 26 $233 put. By dollar amounts, it would be tempting to go with the Jan. 9 covered strangle. However, it depends on whether you’re interested solely in income or buying more IWM at lower prices.
While the Dec. 26 covered strangle’s annualized return of 7.3% [$0.81 premium / $254.81 share price * 365 / 16] is the lowest of the three, it’s the one I’d be inclined to use in this situation.
On the date of publication, Will Ashworth did not have (either directly or indirectly) positions in any of the securities mentioned in this article. All information and data in this article is solely for informational purposes. For more information please view the Barchart Disclosure Policy here.
/An%20Intel%20sign%20out%20front%20of%20a%20corporate%20office%20by%20wolterke%20via%20Adobe%20Stock.jpeg)

/Microsoft%20headquarters%20By%20Peter.jpeg)
/A%20close-up%20of%20the%20Broadcom%20logo%20on%20a%20smartphone%20by%20Timon%20via%20Adobe%20Stock.jpeg)
/Chipset%20held%20over%20rush%20hour%20traffic%20by%20Jae%20Young%20Ju%20via%20iStock.jpg)