Corn Key Levels For The Week, 438.00(Z), 452.00 (H)
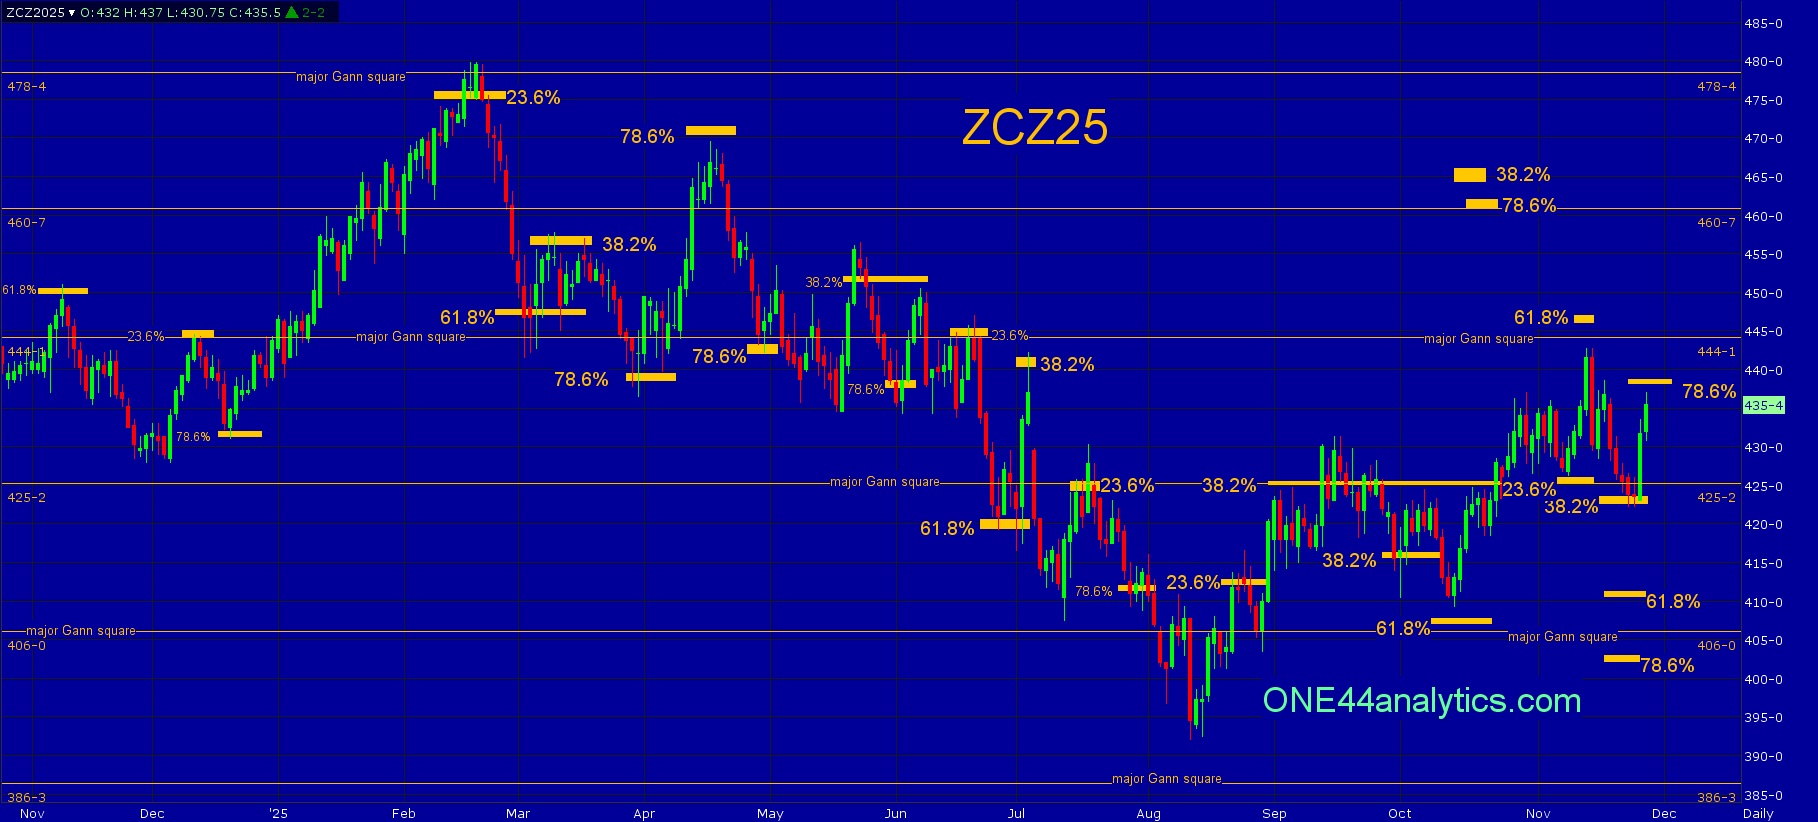
The chart is key to this analysis.
This was from the 11/20/25 update,
The initial setback this week held 23.6% at 431.00, but failed to make a new high for the move, it closed below it today and this will be the key level for the week.
Use 431.00 as the swing point for the week again.
Below it, the short term target is 38.2% of the same move at 423.50, this is the level that needs to hold to keep the short term trend positive.
The low for the week hit 38.2% at 423.50 and this kept the short term trend positive and we are looking for a new high from it.
So far it has had a good rally from 423.50 (435.50 close), however we watch all the retracements on every move to see just how strong, or weak the market is regardless of the long term target, so we have to watch the 78.6% retracement back to the 11/14/25 high at 438.00 and this will be the swing point for the week.
Following the ONE44 78.6% rule,
Any market that hits 78.6% should go 78.6% back the other way. This is also where a lot of Bull markets end and start.
We know that a failure to make a new high in the area of a 78.6% retracement can be the end of the rally for now, or send it 78.6% the other way to start.
The same level for the March is 452.00.
On the chart you can see how many highs and lows end at a Fibonacci retracement.
We have done over 45 videos on how to use the Fibonacci retracements with the ONE44 rules and guidelines.
ONE44 Analytics where the analysis is concise and to the point
Our goal is to not only give you actionable information, but to help you understand why we think this is happening based on pure price analysis with Fibonacci retracements, that we believe are the underlying structure of all markets and Gann squares.
If you like this type of analysis and trade the Grain/Livestock futures you can become a Premium Member.
You can also follow us on YouTube for more examples of how to use the Fibonacci retracements with the ONE44 rules and guidelines.
Sign up for our Free newsletter here.
FULL RISK DISCLOSURE: Futures trading contains substantial risk and is not for every investor. An investor could potentially lose all or more than the initial investment. Commission Rule 4.41(b)(1)(I) hypothetical or simulated performance results have certain inherent limitations. Unlike an actual performance record, simulated results do not represent actual trading. Also, since the trades have not actually been executed, the results may have under- or over-compensated for the impact, if any, of certain market factors, such as lack of liquidity. Simulated trading programs in general are also subject to the fact that they are designed with the benefit of hindsight. No representation is being made that any account will or is likely to achieve profits or losses similar to those shown. Past performance is not necessarily indicative of future results.


/Intel%20Corp_%20Santa%20Clara%20campus-by%20jejim%20via%20Shutterstock.jpg)
/Nvidia%20logo%20and%20sign%20on%20headquarters%20by%20Michael%20Vi%20via%20Shutterstock.jpg)