Grain Analysis & Targets
The charts are key to this analysis.
There are two methods we use at ONE44 to find support and resistance in the markets.
The first are major Gann squares, these are the yellow horizontal lines on the chart.
The second is Fibonacci retracements.
Here is this week's analysis using these methods.
2/19/26
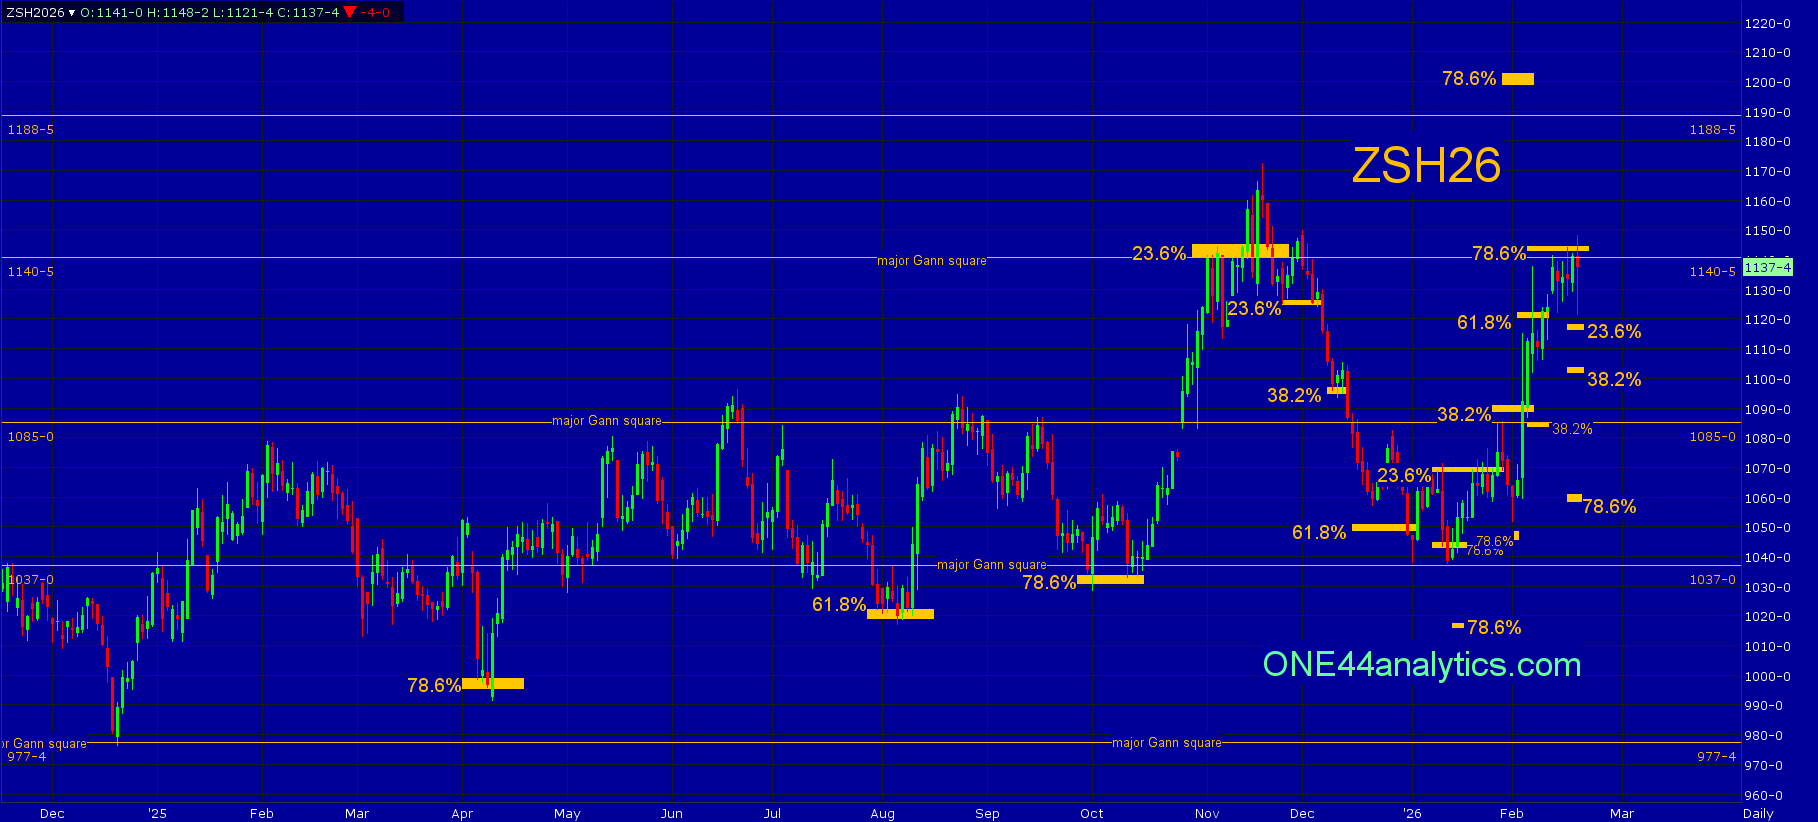
Soybeans
This will be the last update for March.
From last week,
The low for the week held above the 1085.00 (38.2%) swing point for the week (1086.75 low) keeping the short term trend positive and the rally from it hit the longer term target area of the 1140.50 major Gann square and 78.6% at 1143.00, this will now be the key level for the week. A setback from a 78.6% retracement can send it 78.6% back the other way per the ONE44 78.6% rule, however as always we will watch all the retracements on any setback to see just how weak, or strong the market is regardless of the longer term target.
Use 1143.00 as the swing point for the week.
The high for this week is 1144.00, as of yet there has been no close above that, or the 1140.50 major Gann square. The 78.6% level at 1143.00 will again be the key level for the week. The long term target on a setback from this area is 78.6% the other way per the ONE44 78.6% rule. As always we will watch all the retracements on any setback to see just how weak, or strong the market is regardless of the longer term target.
Use 1143.00 as the swing point for the week.
Above it, the short term target area is the 1188.50 major Gann square and 78.6% back to the contract high at 1198.00. The long term target is also the long term swing point at 1265.00, this is 38.2% on the continuation chart.
Below it, the long term target is 78.6% back to the 1/13/26 low at 1061.00 (ONE44 78.6% rule). The short term target is 38.2% of the same move at 1103.50, holding this level keeps the short term trend positive and a new high can follow. Any setback that holds 23.6% at 1118.50 is a very strong sign and a new high can quickly follow.
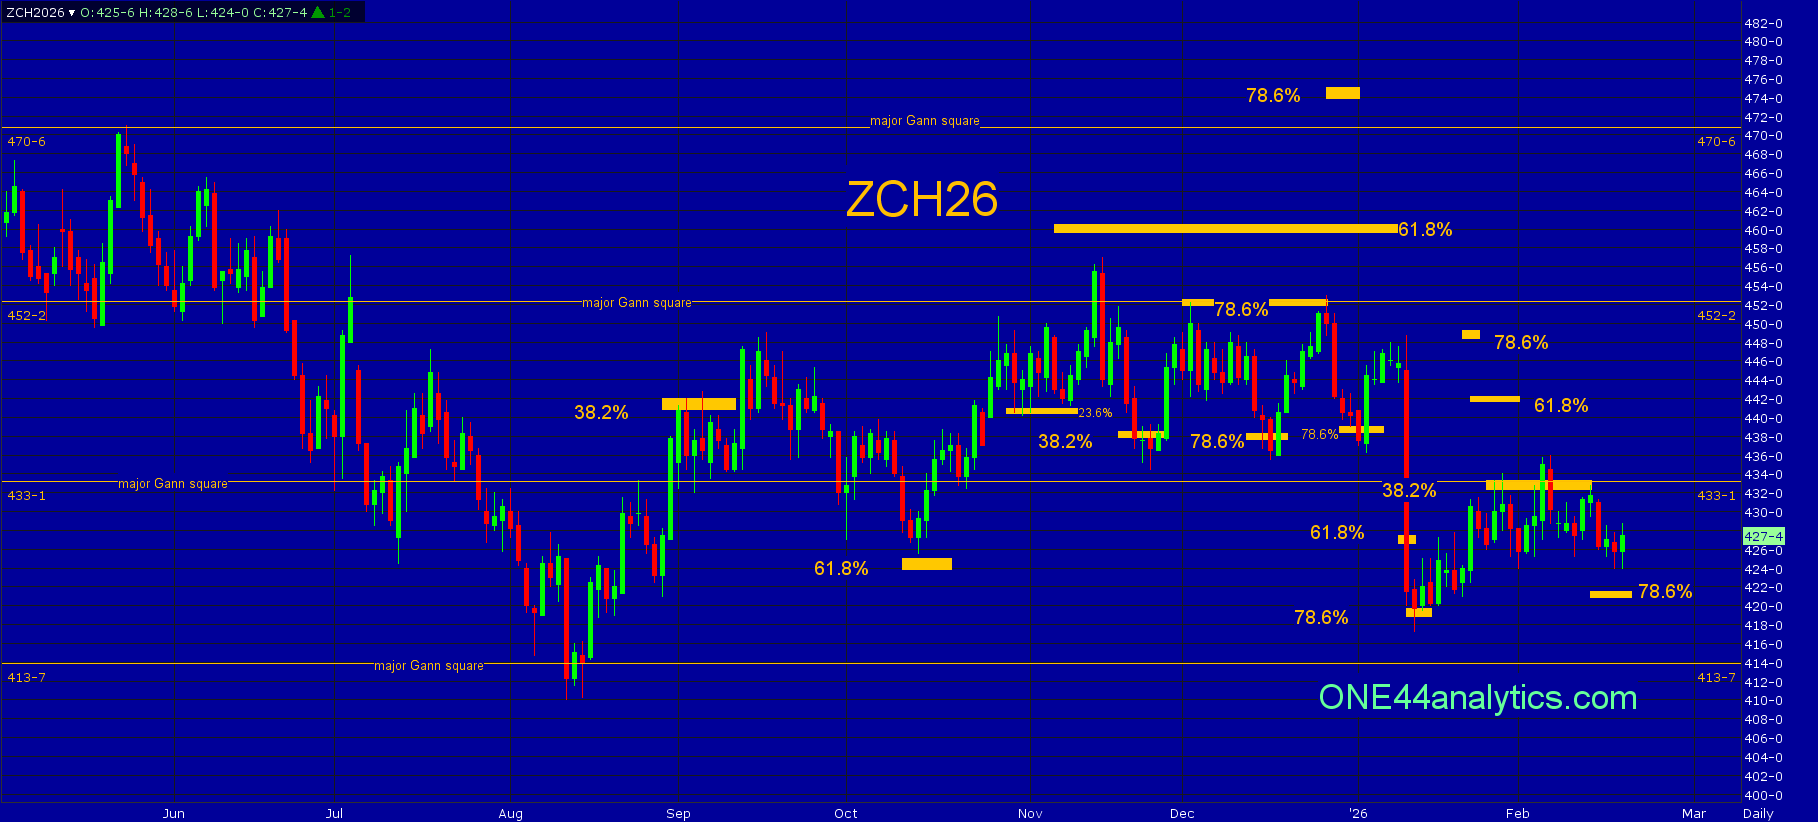
Corn
This will be the last update for March.
From last week,
It did have one close above 432.00 (38.2%), however the next day it was right back below it keeping the short term trend negative. This will again be the key level for the week.
Use 432.00 as the swing point for the week again.
Once again the 38.2% level at 432.00 and the 433.00 major Gann square sent the market lower and keeping the short term trend negative, 432.00 will again be the key level for the week. With no new high, or low all the Above/Below targets remain the same.
Use 432.00 as the swing point again.
Above it, turns the short term trend positive, The longer term target is 78.6% back to the 11/14/25 high at 448.00 (ONE44 78.6% rule). The short term target is 61.8% of the same move at 442.00.
Below it, the short term target is 78.6% back to the 1/13/26 low at 421.00, a failure to turn back up from this area will give us only major Gann squares to look for support and then use as the swing point when closed below, the next two are 413.75 and 394.00.
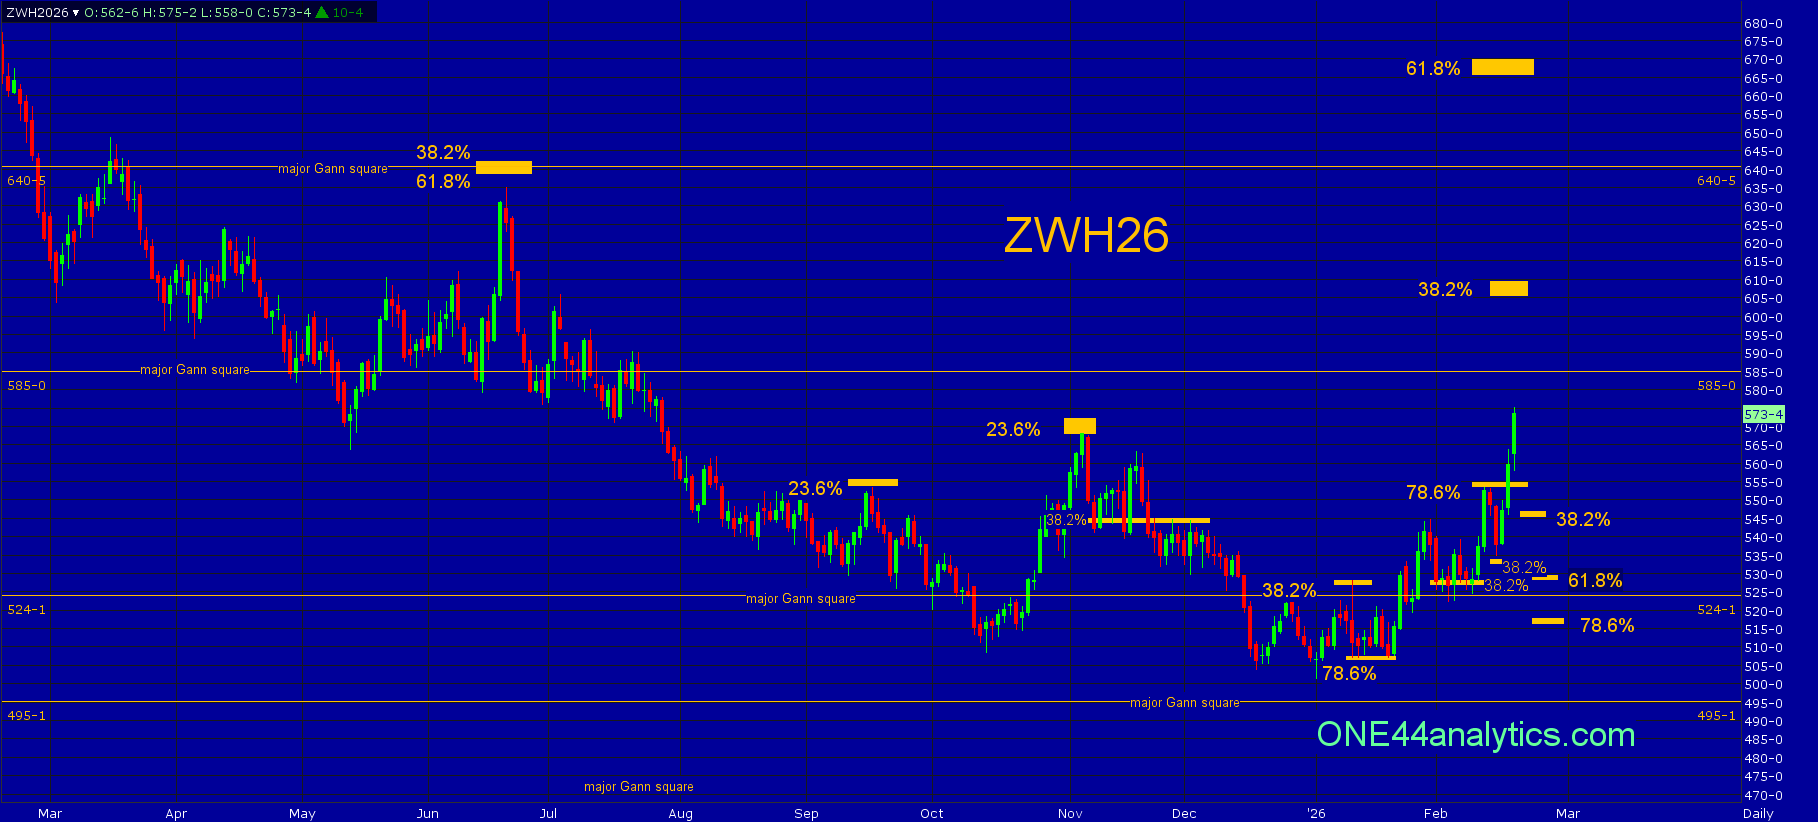
Wheat
This will be the last update for March.
From last week,
All of this week held the 528.00 (38.2%) swing point backed up by the 524.00 major Gann square keeping the short term trend positive. The rally from there fell 2 ticks short of the short term target of 78.6% at 554.00 and this will be the key level for the week.
Use 554.00 as the swing point for the week.
Below it, ....The short term target is 38.2% at 533.50, this is the level that needs to hold to keep the short term trend positive....
The setback from the 554.00 (78.6%) swing point fell just short of 38.2% at 533.50 (535.00 low) and that kept the short term trend positive and a new high followed. It is currently trading above 554.00 and this will again be the key level for the week.
Use 554.00 as the swing point for the week again.
Above it, the short term target is the 585.00 major Gann square. The long term target is also the long term swing point at 606.00, this is 38.2% on the continuation chart.
Below it, getting right back below 554.00 (78.6%) will again give us a longer term target of 78.6% the other way at 514.00 per the ONE44 78.6% rule. The short term target is 38.2% at 538.00, this is the level that needs to hold to keep the short term trend positive.
ONE44 Analytics where the analysis is concise and to the point
Our goal is to not only give you actionable information, but to help you understand why we think this is happening based on pure price analysis with Fibonacci retracements, that we believe are the underlying structure of all markets and Gann squares.
If you like this type of analysis and trade the Grain/Livestock futures you can become a Premium Member.
You can also follow us on YouTube for more examples of how to use the Fibonacci retracements with the ONE44 rules and guidelines.
Sign up for our Free newsletter here.
FULL RISK DISCLOSURE: Futures trading contains substantial risk and is not for every investor. An investor could potentially lose all or more than the initial investment. Commission Rule 4.41(b)(1)(I) hypothetical or simulated performance results have certain inherent limitations. Unlike an actual performance record, simulated results do not represent actual trading. Also, since the trades have not actually been executed, the results may have under- or over-compensated for the impact, if any, of certain market factors, such as lack of liquidity. Simulated trading programs in general are also subject to the fact that they are designed with the benefit of hindsight. No representation is being made that any account will or is likely to achieve profits or losses similar to those shown. Past performance is not necessarily indicative of future results.
/Nvidia%20logo%20and%20sign%20on%20headquarters%20by%20Michael%20Vi%20via%20Shutterstock.jpg)


/Intel%20Corp_%20Santa%20Clara%20campus-by%20jejim%20via%20Shutterstock.jpg)