
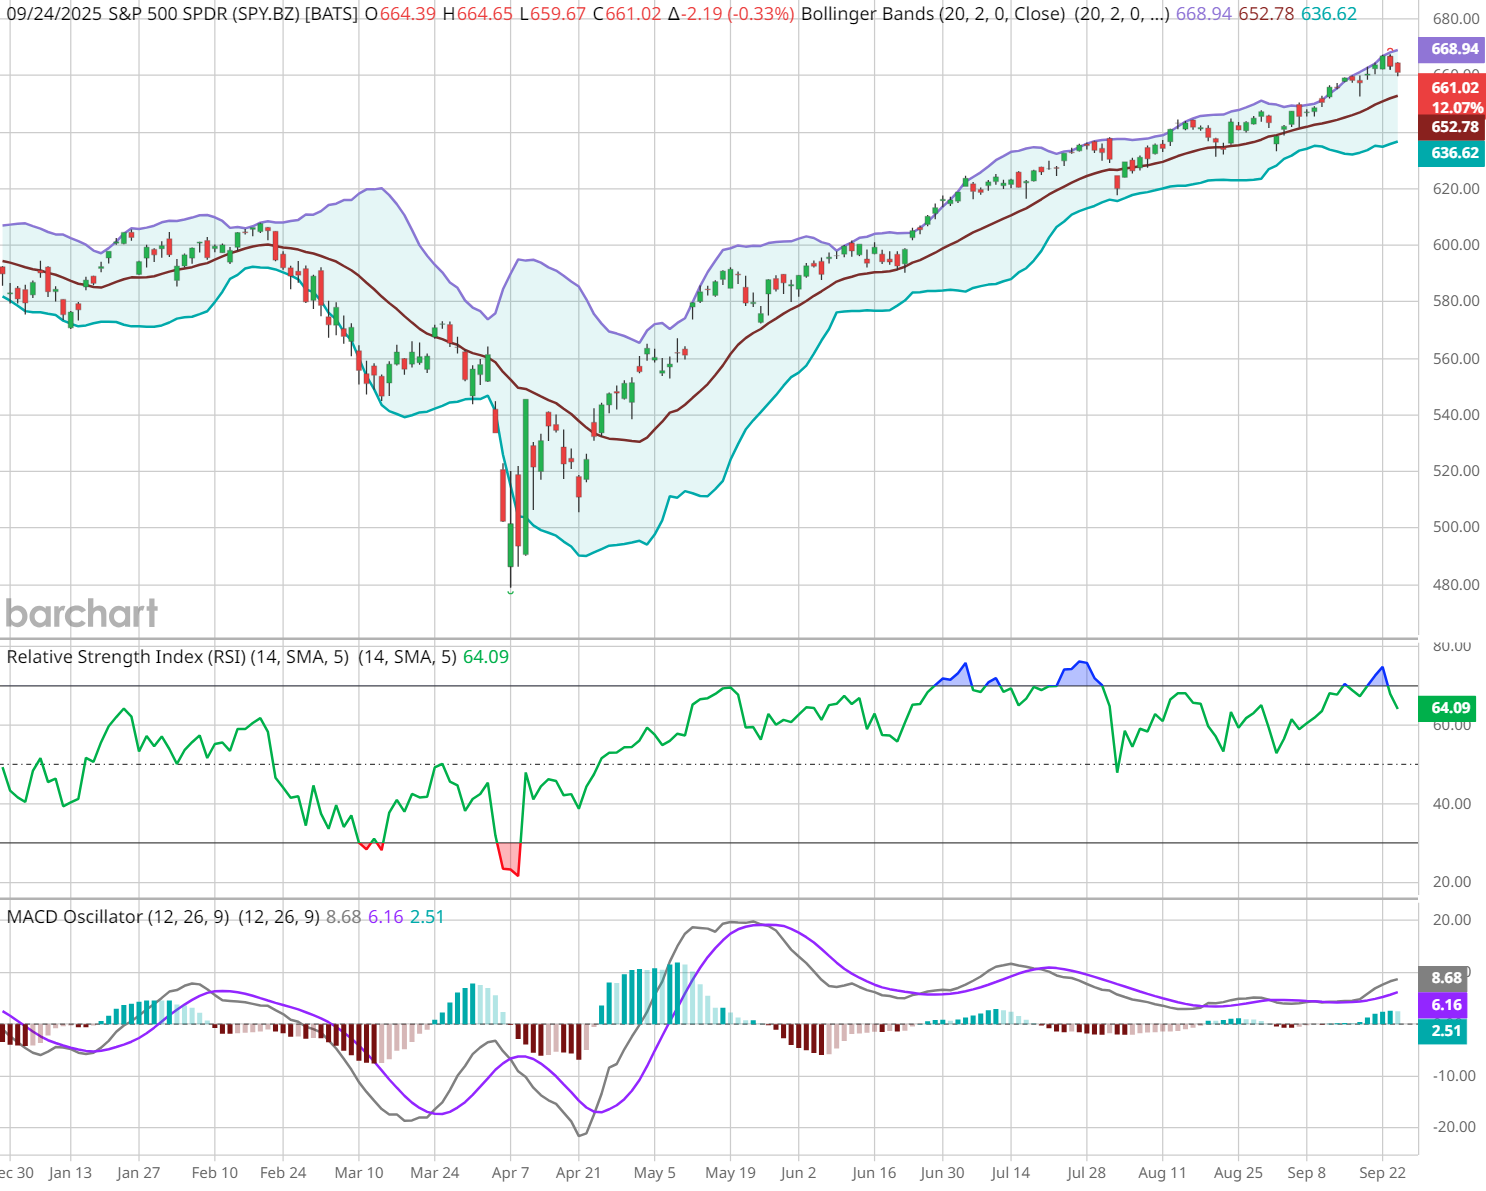
Back in late April, John Rowland, CMT, flagged a V-bottom in the S&P 500 ($SPX) and projected an upper-level target near $668 on the SPDR S&P 500 ETF (SPY). Right now, price is basically there — within a point of his objective.
During last Friday’s Market on Close, John walked through what he’s seeing now: why V-bottoms can grind higher in a “methodical rise,” how to think about triple-witching energy at targets, and which indicators suggest either continuation or a pause.
Why The $668 Area Matters
- Measured move logic: After a V-bottom recaptures the origin of the selloff, John extrapolates trough → peak to project an upside objective. That math lands ~$668 on SPY.
- Time/positioning: Approaching targets into triple-witching options expiration often injects hedging/roll flows that can amplify short-term swings. Hence, the push higher in stocks last week.
What John’s Watching Now
- RSI divergence (daily): Price made a higher high while Relative Strength Index (RSI) made a lower high → negative divergence that often precedes digestion.
- RSI (weekly): Not overbought on weekly, so the bigger trend isn’t screaming “exhausted.”
- Bollinger Bands (daily): Price is tagging the upper band. Classic reading: markets can “ride the band,” but stretches above it frequently mean-revert.
- MACD (daily): Momentum still positive, but a flattening or cross after divergence would confirm a pause.
Trade Plan Ideas (Education, Not Advice)
Scenario A – Upside continuation:
What to see: Daily RSI re-accelerates, MACD expands, closes above the upper Bollinger band follow through (no immediate reversal).
How to track it on Barchart:
- SPY Interactive Chart → add RSI, MACD, Bollinger Bands.
- Seasonality → Compare VIX & SPY for typical returns during Sept-Nov.
- Expected Move → probability rails for weekly ranges.
Scenario B – Digest/mean-revert pullback:
What to see: Failure to hold break above the band, RSI divergence persists, daily MACD rolls.
How to track it on Barchart:
- Trader’s Cheat Sheet → next blue (support) / red (resistance) levels for the session.
- Gamma Exposure (GEX) → see if negative gamma zones could amplify swings.
- Economic Calendar → catalysts that could trigger the pullback window.
Watch, Learn, Act
Watch the clip as John explains the V-bottom target and why divergences matter at inflection points:
- Stream the full episode: More context on price targets, market sectors, and positioning.
- Turn on notifications so you catch the next live Market on Close right as setups evolve.
On the date of publication, Barchart Insights did not have (either directly or indirectly) positions in any of the securities mentioned in this article. All information and data in this article is solely for informational purposes. For more information please view the Barchart Disclosure Policy here.


/Renewable%20Energy%20by%20Yuri%20Hoya%20via%20Shutterstock.jpg)
/A%20close-up%20of%20a%20General%20Motors%20corporate%20sign%20by%20lindaparton%20via%20Adobe%20Stock.jpeg)