
Let me say the quiet part out loud: The Nasdaq-100’s (QQQ) intraday volatility should have every trader and investor on high alert.
If you’ve been watching the intraday price action lately, your eyes aren't deceiving you. The Invesco QQQ Trust (QQQ), which has been my swing-trading focus for much of this year, is moving with the kind of intense, erratic velocity that we typically only witness during historic periods of absolute market chaos.
After all, we’ve already had “rolling corrections” in several sub-sectors, including software (IGV), gold mining stocks (GDX), several commodities, and even digital REITs (IDGT).
A remarkable piece of data just cleared the tape that completely validates this daily observation. According to CBOE, the volatility concentrated specifically within technology stocks has officially shattered a 23-year record. The statistical gap between the Nasdaq-100 Volatility Index and the standard S&P 500 Volatility Index ($VIX) has widened to a staggering 12 points.
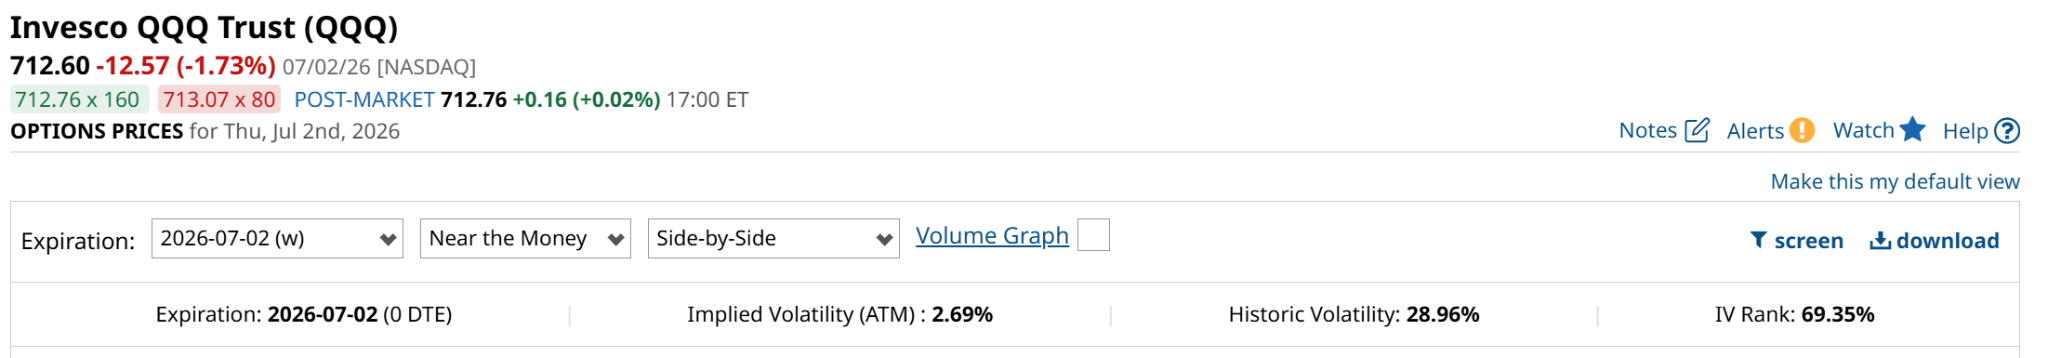
That picture above shows that the IV Rank for QQQ within the past 52 weeks is just under 70%. As a trader, this is delightful. But there’s a bigger issue here.
You see, this divergence is wider than it was during the absolute depths of the 2008 Financial Crisis (7 points) and higher than the peak of the 2020 pandemic panic (11 points). We are witnessing an unprecedented level of separation between two index ETFs (SPY and QQQ) that we are more used to seeing correlated.
This is one reason why, in the ROAR 10 ETF model portfolio that is one of the core parts of my personal portfolio, I do not include SPY.
Instead I include QQQ and the SPDR Dow Jones Industrial Average ETF (DIA). Those two, used in tandem, have been a better way to navigate this market beyond a trader’s time frame.
This divergence has an ominous signal to me: the vaunted tech sector is under extreme, isolated duress while the rest of the market pretends everything is relatively normal. That’s something we have not seen in a long time.
This chart only goes back 10 days, and covers 1-minute time frames. That is not something I tend to dwell on here, but this is an exception. Because it shows you what I see on my screen throughout the trading day.
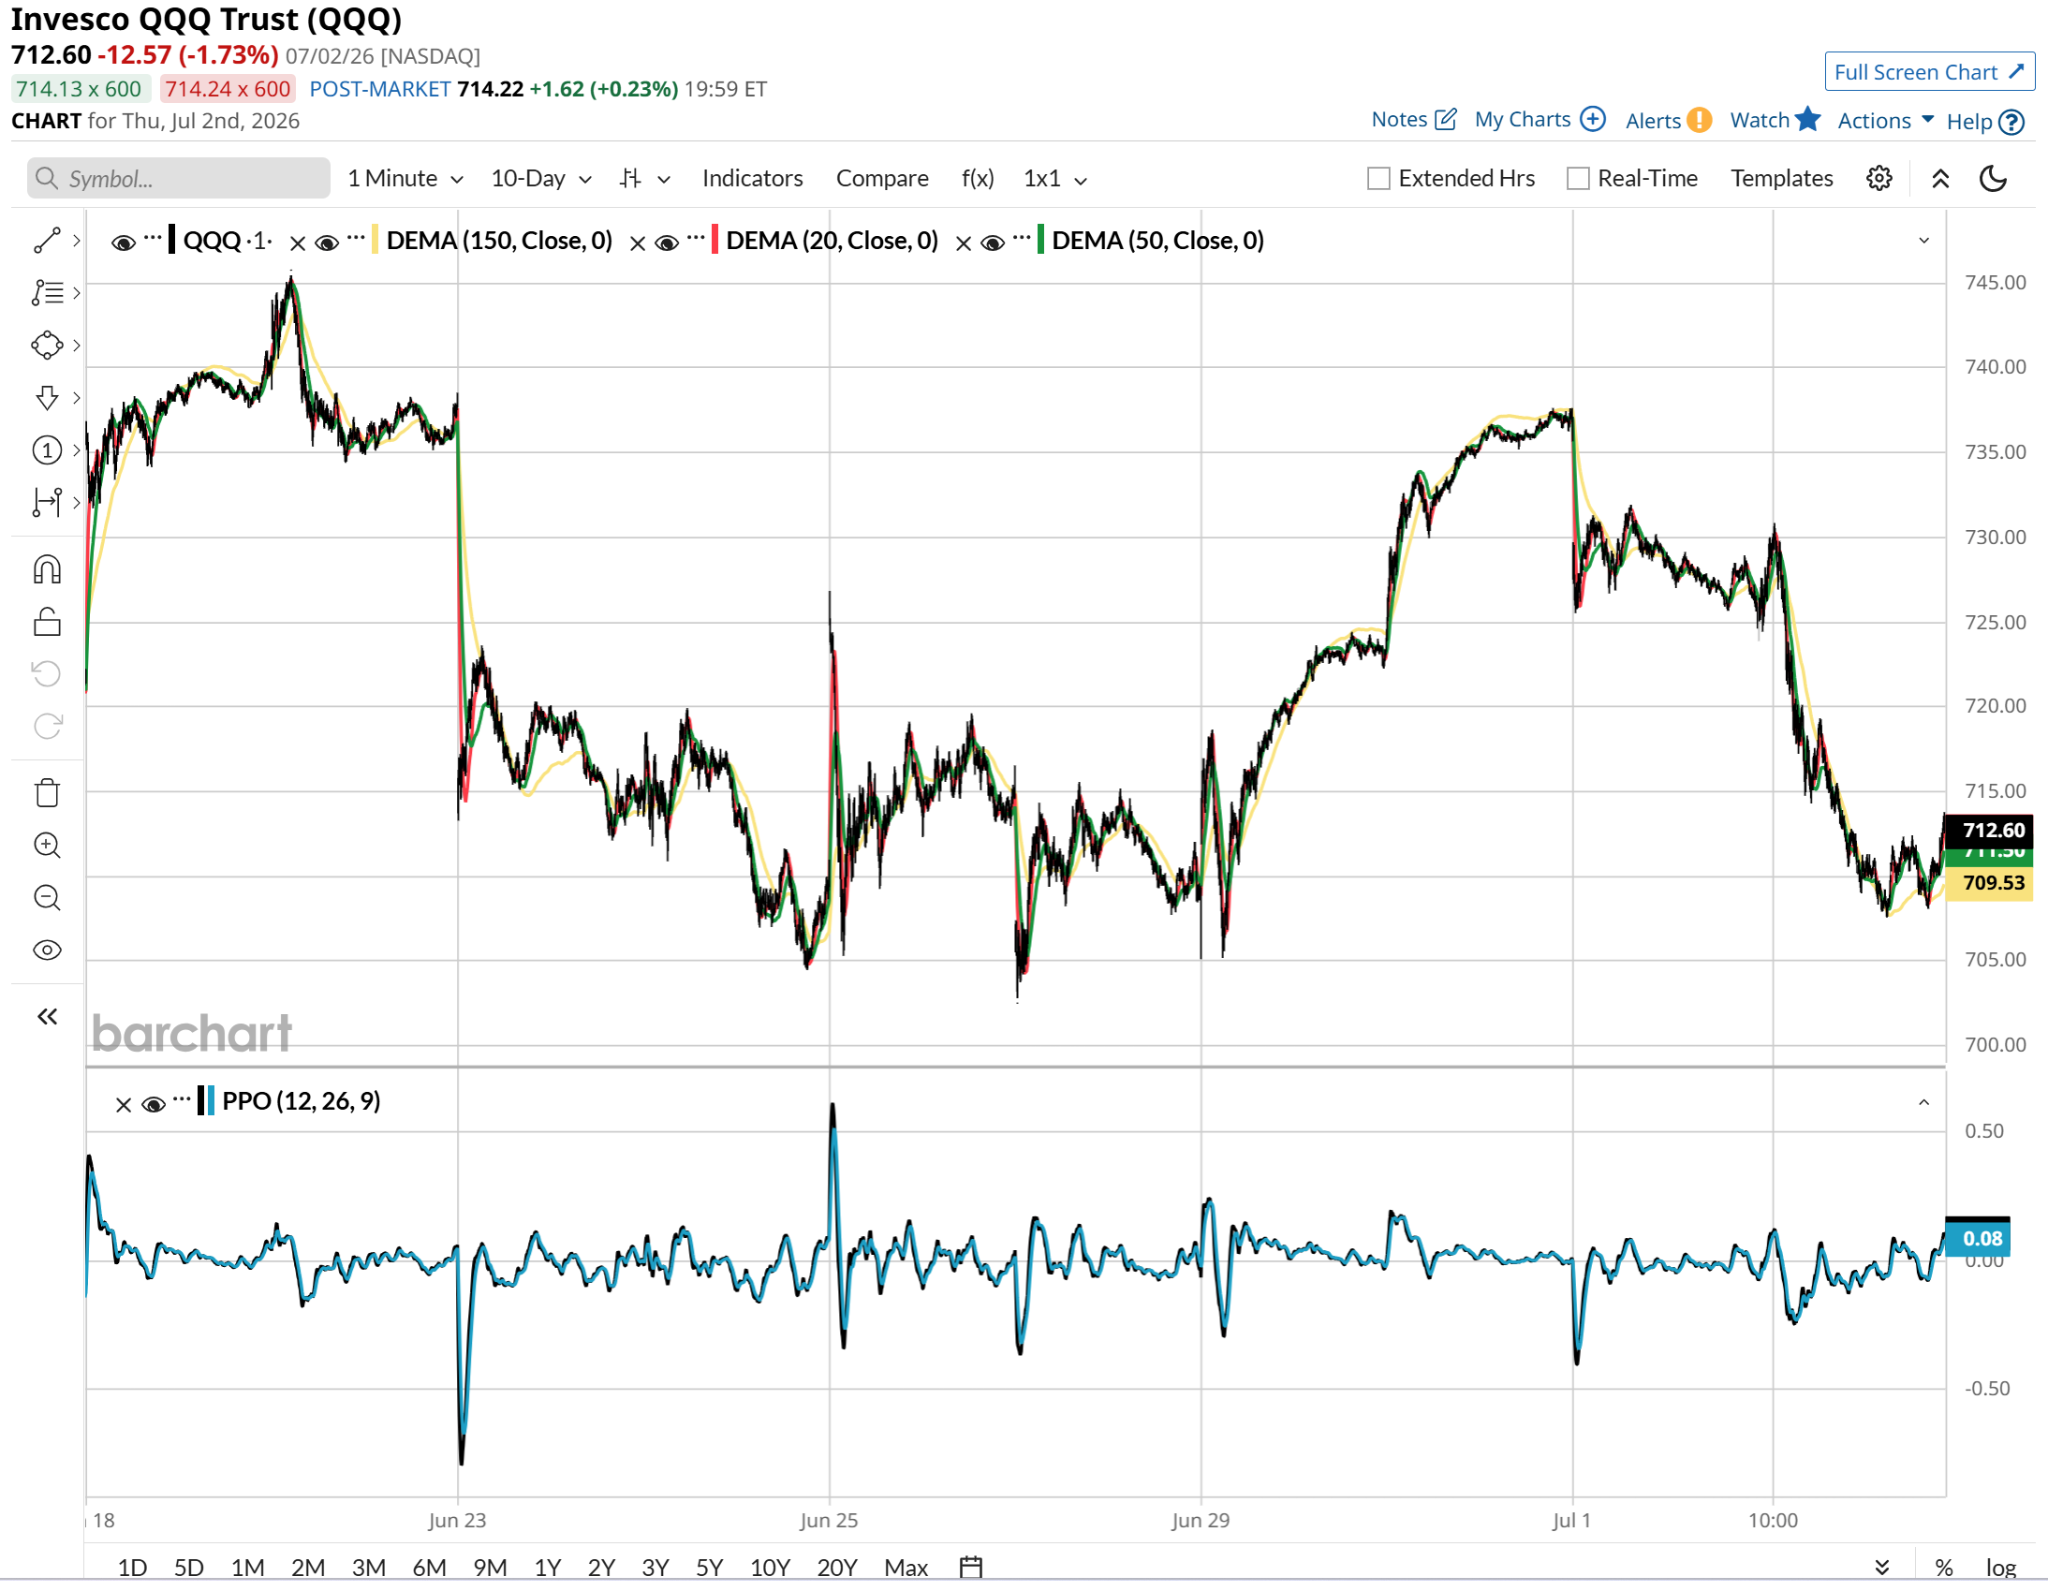
Skip past the moves at the open, and instead look intraday. I see $15 moves in QQQ routinely occurring. That’s a 2% intraday swing. This is not normal! And it renders the Nasdaq-100 more vulnerable to a sustained decline than it has been in a while.
Remember, the sharp pullbacks we’ve seen so far this decade, starting with the Covid-19 crash in 2020, have actually favored QQQ on a relative return basis. Big tech stocks have been the “quality/safety trade” for years.
This spread between Nasdaq-100 and S&P 500 volatility prompts me to assume that big institutional money desks are aggressively pricing in substantial uncertainty for technology names. They are quietly paying a premium for protection on their tech exposure while keeping the broad index stable. When a pronounced split reaches historical extremes like this, I have to conclude it is a warning that this intraday and day-to-day QQQ volatility will not simply vanish.
Rob Isbitts is a semi-retired CIO, former fiduciary investment advisor, and Barchart columnist. Check out his other work at ETFYourself.com (featuring the Fresh Charts weekly trading post), and ROAR.PiTrade.com, helping investors to better-manage their own portfolios.
On the date of publication, Rob Isbitts did not have (either directly or indirectly) positions in any of the securities mentioned in this article. All information and data in this article is solely for informational purposes. For more information please view the Barchart Disclosure Policy here.
/Microsoft%20headquarters%20By%20Peter.jpeg)
/Micron%20Technology%20Inc_%20logo%20on%20building-by%20vzphotos%20vis%20iStock.jpg)
/NVIDIA%20Corp%20logo%20outside%20building-by%20BING-JHEN_HONG%20via%20iStock.jpg)
/Amazon%20-%20Image%20by%20bluestork%20via%20Shutterstock.jpg)
/Robot%20arm%20industrial%20automation%20manufacturing%20by%20Eakrin%20via%20Adobe%20Stock.jpeg)