
Let’s flash back to 1993. I was still hanging on to my 20s and newly married, and I was working on the 97th floor of the World Trade Center in New York City.
In February of that year, a terrorist group tried to bomb the beloved building from the basement. I will never forget waiting to find out what was happening. We could only guess – there were no mobile phones to keep us tapped into real-time updates and news coverage. I was stuck nearly 100 floors up.
Four nervous hours later, the heroic firemen reached our floor and told us it was safe to go back down to the street. We just had to walk it. And we did.
It turns out the terrorists’ van was parked in the wrong spot, sparing the World Trade Center most of the damage. That’s the only reason thousands of us survived.
I’ve found that the stock market operates the same way real life does. When the damage is real, you use the stairs to go down. It doesn’t matter that you took the elevator up.
Take a breath, move ahead
The biggest hurdle for investors like me who purport to “play offense and defense at the same time” is to not hedge away all the upside when they’re scared of life getting real.
I’ve had my share of “slumps” as an investor, which I define as returns that are meekly positive in a dynamic, rising stock market. The one issue I have not had throughout my career is “losing big.”
The biggest peak-to-trough loss I can recall at a portfolio level happened during the first seven months of my tenure as a mutual fund manager. The fund started trading on Aug. 16, 2008. By March 2009, my “hedged equity” fund was down around 16%. Maybe I should mention that the S&P 500 Index ($SPX) had fallen by 55% over those same seven months.
Here’s what it looked like:
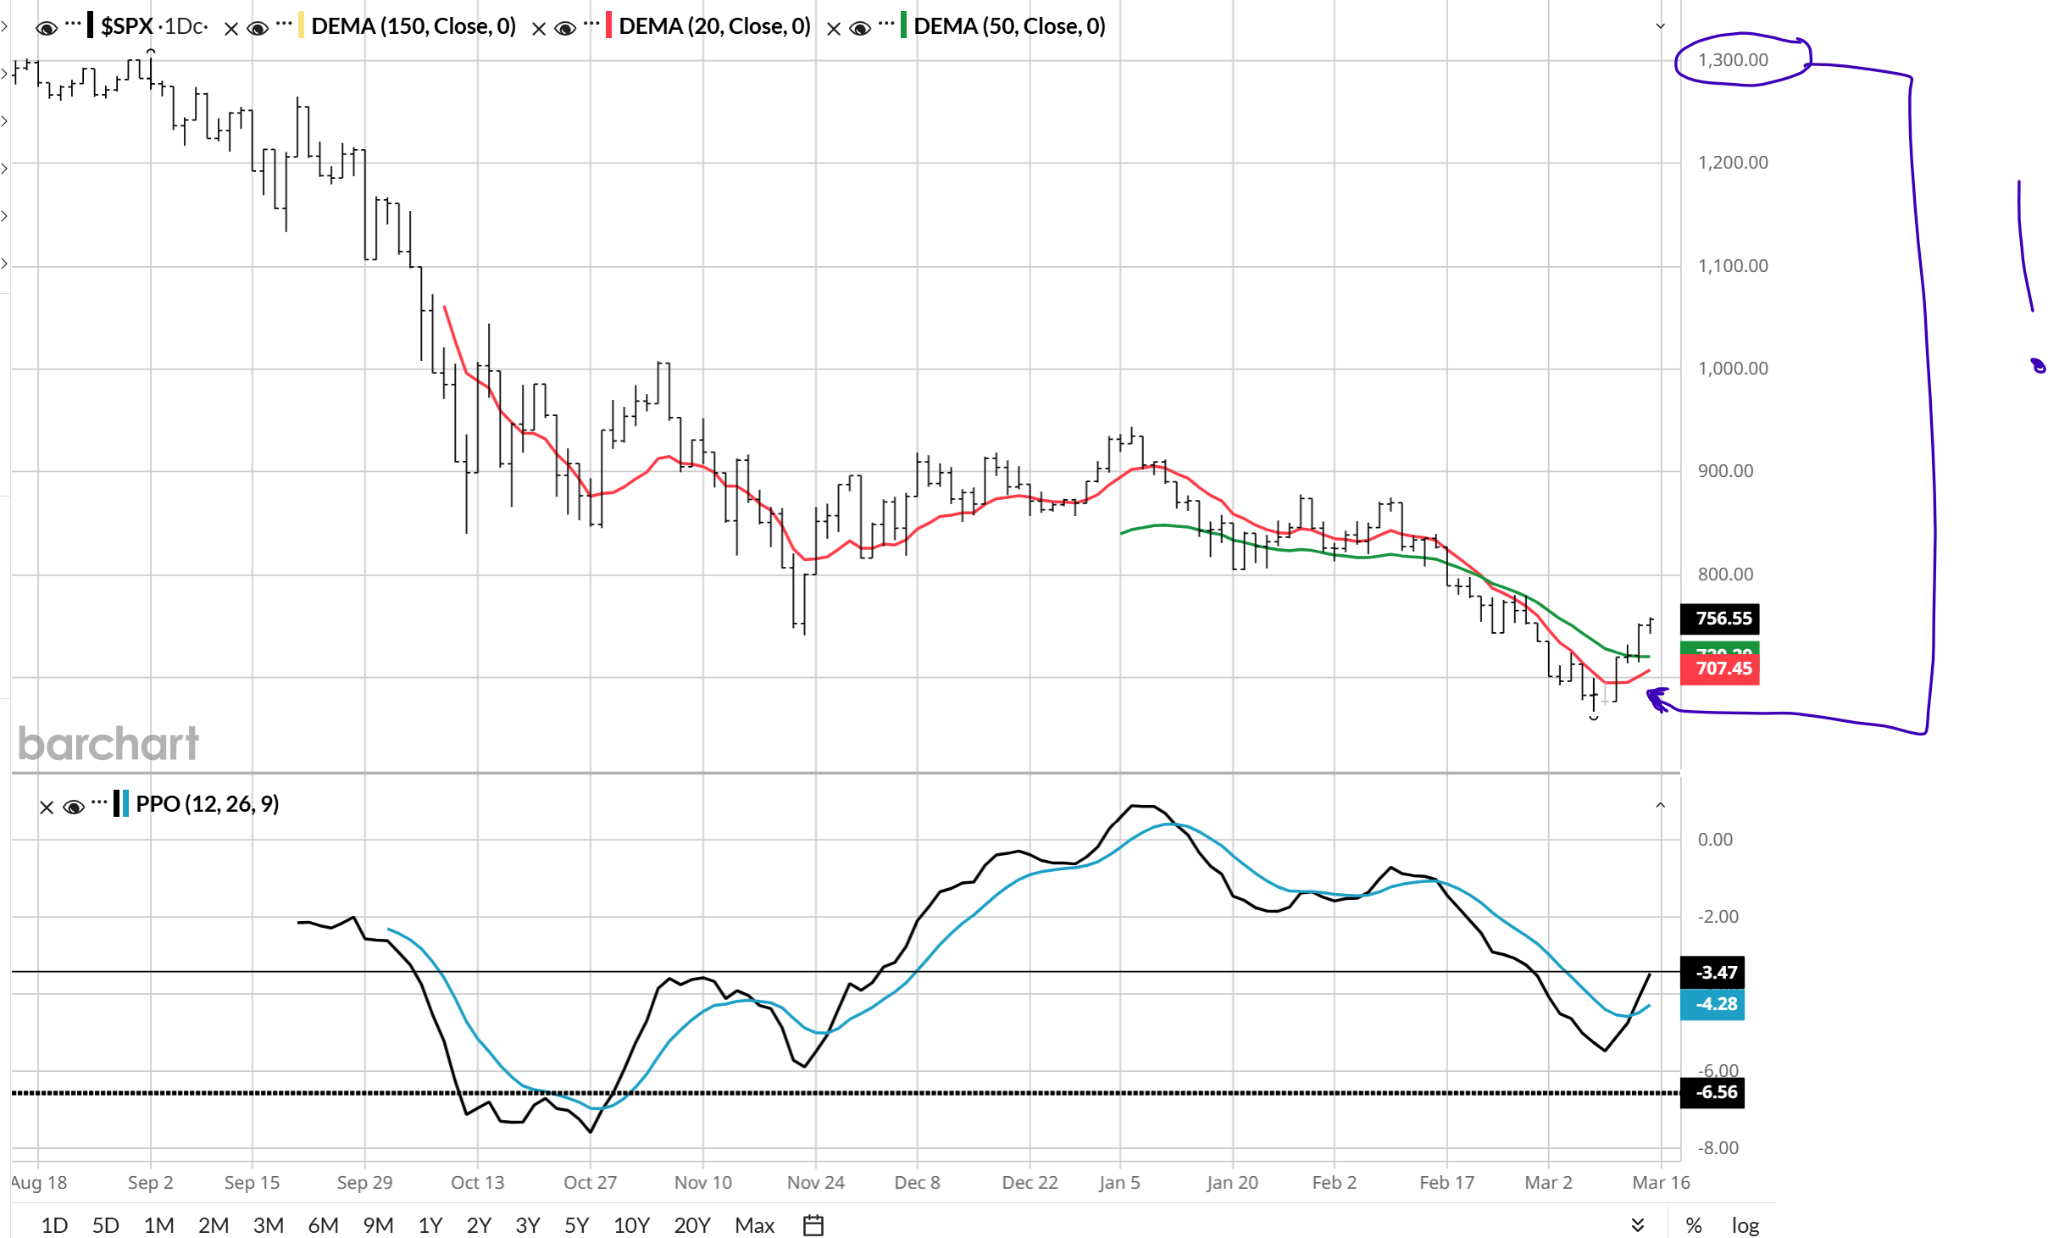
Since that time, I’ve spent hours on Barchart with the goal of capturing the specific technical analysis “coordinates” to set myself and others up to navigate crashes ahead.
It turns out that 2008 followed a similar pattern to the dot-com crash. The 2020 crash at the start of the Covid-19 pandemic did too. As the S&P 500 Index dropped 34% over five weeks, I managed to make my then-clients a 2% return.
Don’t try to convince me that technical analysis doesn’t save lives, financially speaking. Or, that Barchart’s tool set for technical analysis isn’t the best around. I’m not buying either of those arguments. I swore I’d never lose 16% peak to trough again. And I haven’t.
But I’ve had some periods of 6-12 months in which I didn’t make much despite market headlines screaming of “new all-time highs” daily. While younger investors can take a “YOLO” approach with the idea they will have decades to make it up, I’m not so young anymore. I’m not willing to take a 15%, 25%, or 50% loss in stride.
Thankfully, while the Rob Isbitts of today is largely the same as the Rob Isbitts of 2020, 2008, and 1993, the stock market has changed. We now have remarkably more ways that we can hedge risk and capital on a stock’s future path, regardless of which direction it takes.
That means investors like me can avoid another 16% peak-to-trough loss without having to forgo gains on high-priced stocks.
There’s a wide range of new investing strategies available to help you do the same, but one in particular helped me get over my fear of heights.
How this risk manager learned to take risks
Historically, I stayed away from high-priced stocks, despite knowing they offered giant return potential on the downside. That’s because “the market can stay up longer than you can stay solvent,” making short selling akin to committing a financial felony against your wallet.
Plus, a stock’s volatility makes buying put options very expensive. This is true even if the volatility is to the upside.
Enter my new confidence-boosting strategy.
My goal here is to look at stocks that have been bought, bought some more, and are now being bought at their highs by traders hoping to sell them even higher. That’s also known as the “greater fool theory.” While I’m a fool for not focusing on these stocks when they were much cheaper, there’s another relevant expression here.
The stock market takes the stairs up, and the elevator down.
Remember that you can make 10% or 20% on a trade over a few months, and see the profit evaporate in a few days. All it takes is a turn in market sentiment or one bad earnings report. The type that renders stop orders useless. Because if you have a stop in at $98 on a $100 stock, and it misses earnings and opens the next day at $85, you are not selling it for $98. You are selling it for $85.
I want a different outcome, and Barchart showed me how a simple collar trade can help me achieve it.
To take the unhedged danger out of trading wild stocks, you need a premeditated plan of attack. I searched to see what happens when you do the following:
- Own 100 shares of stock.
- Sell one covered call option on that stock.
- Buy several protective put option contracts on that stock, with strike prices well below the current price of the stock.
The first two items above are standard.
What’s less so is the third item, my approach to downside protection. If the stock falls a little, I hope to make a little. If the stock falls a lot, I want to make more. But the best-case outcome here is a true crash in the stock before my expiration date.
If we break down the three parts of the collar more generically, in terms of their potential, here’s what we have:
- The stock represents 100 shares.
- The covered calls are essentially acting like a short position of 100 shares. One contract equals 100 shares, and while you receive your option premium up front, you are doing so in exchange for not allowing yourself to make money above the call option strike price.
- The put options also are like shorting 100 shares of that stock, except that they won’t act like a full-fledged short position until two things happen. First, the stock has to fall to that put strike price level. Second, the expiration date has to arrive.
Until that time, just as with the call side of this collar setup, the market is essentially assigning odds through an industry-standard calculation, which is why option prices whip around more than stock prices do. Much more, in fact.
Here we go, step by careful step
What better way to illustrate this scenario than with Intel (INTC), which is up nearly 250% in the year to date?
It all starts with the chart. I can define some key pressure points using the 20-day and 50-day moving average, and especially via my favorite momentum and strength indicator, the Percentage Price Oscillator (PPO), which you can see at the bottom of the chart.
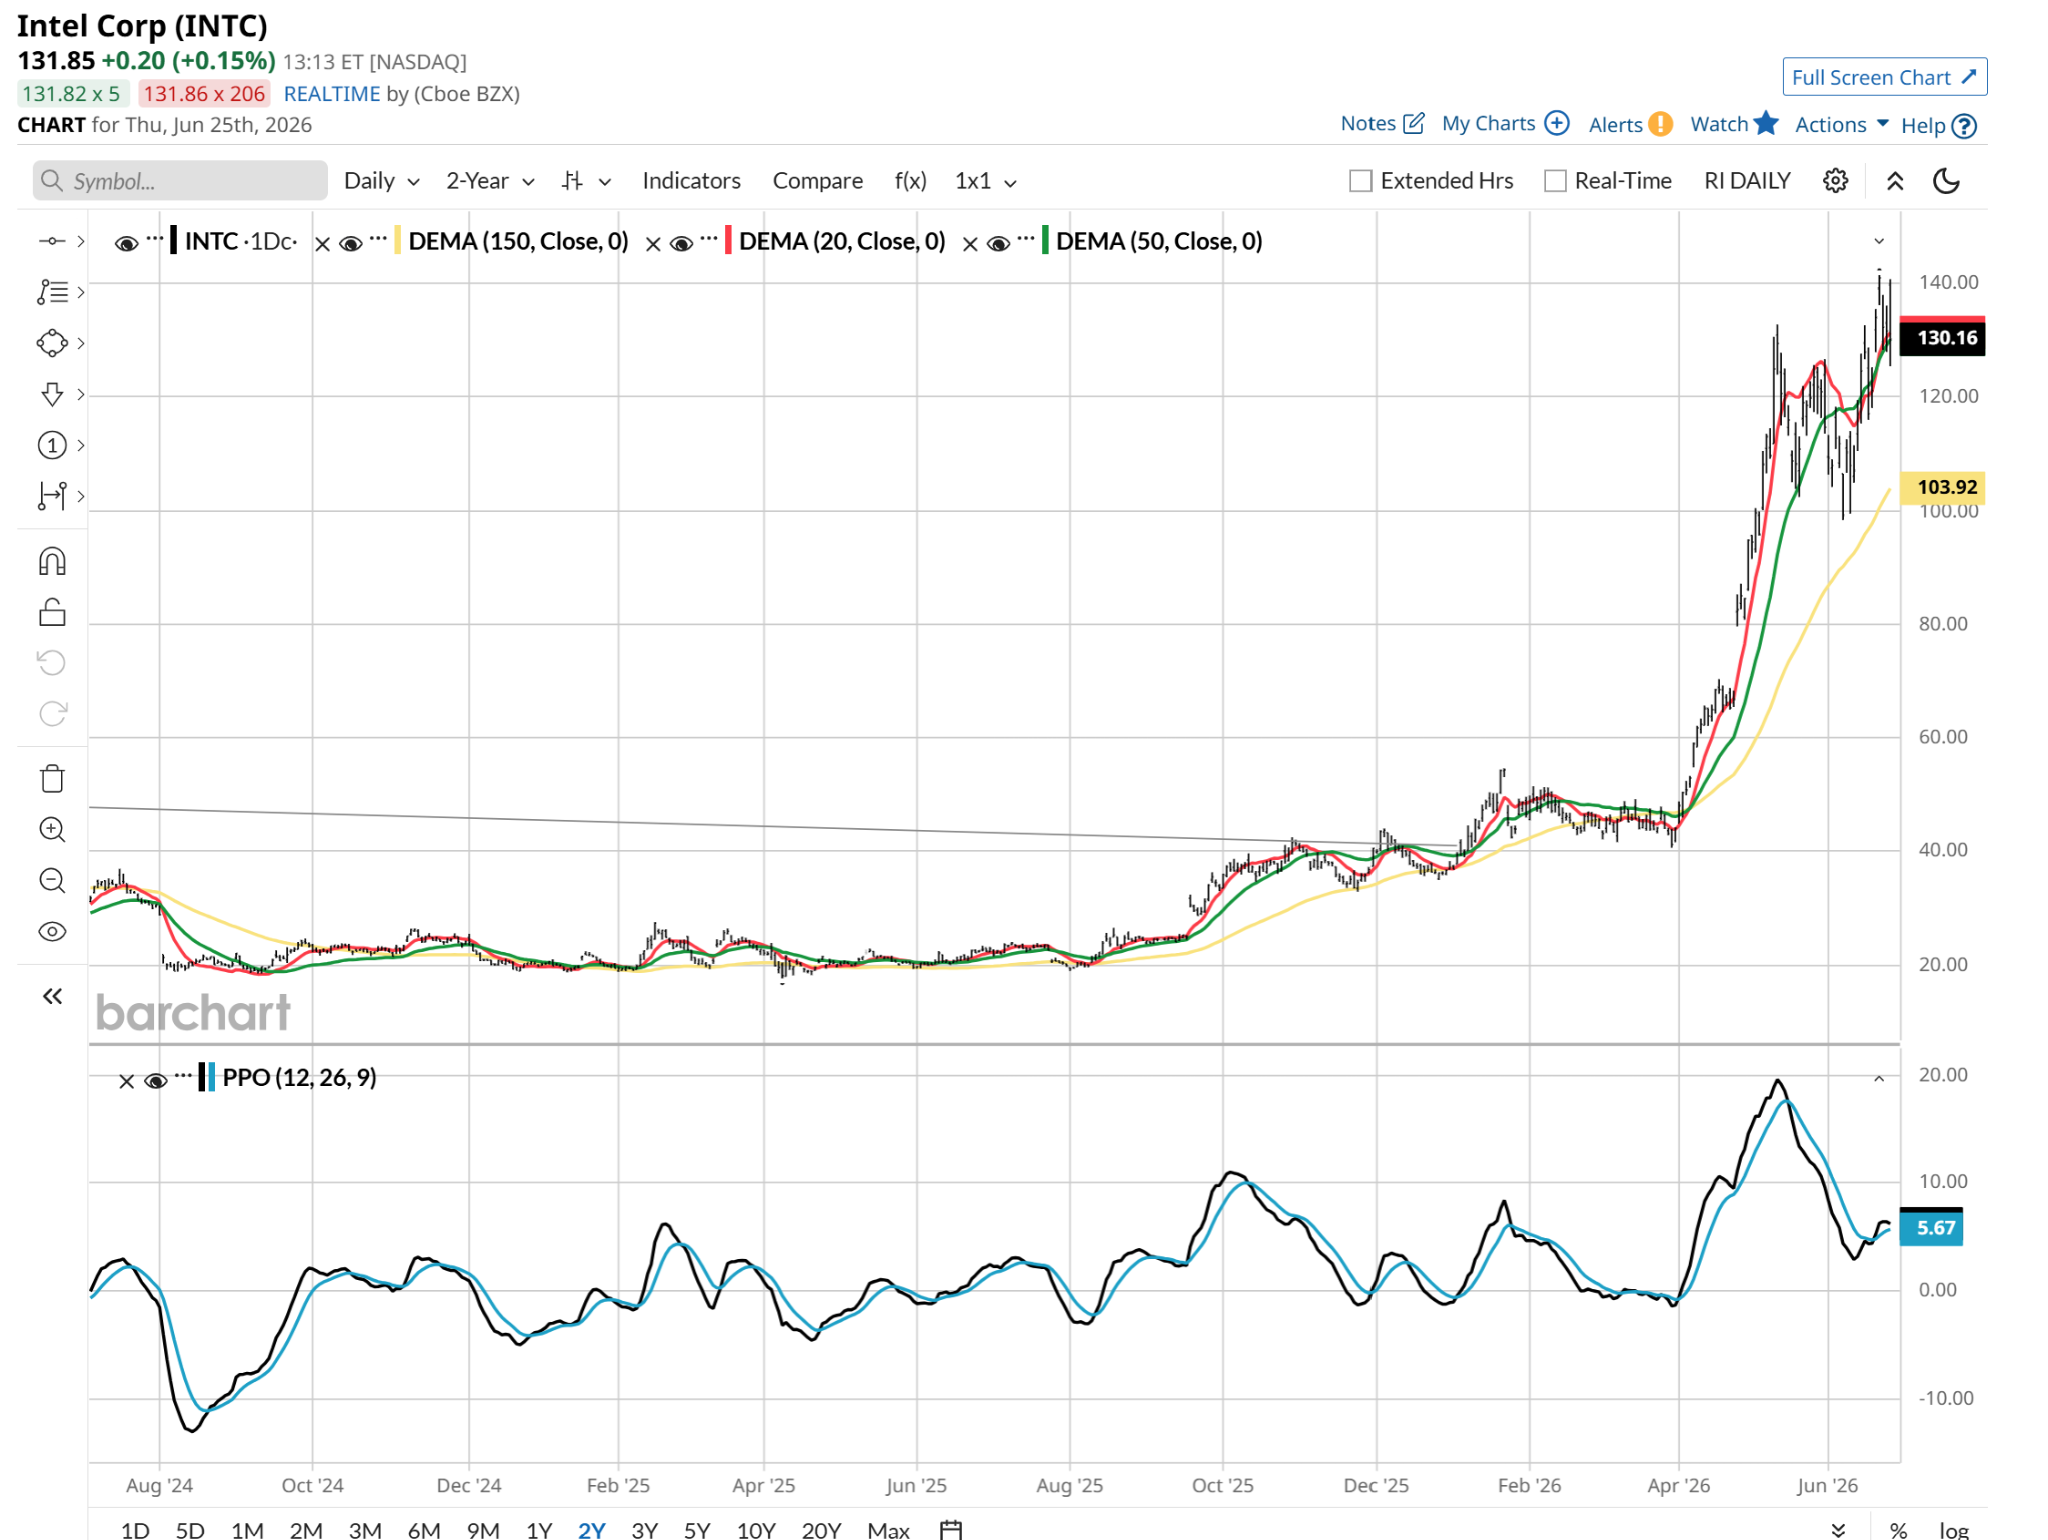
This chart is highly indecisive, in that it has paused, but not broken down. I can make a case for the PPO being in the process of “failing” since that black line crossed over the blue line, but it’s flat. That indicates some weakness to me. However, I have to acknowledge the reality that the market currently loves Intel. I am just trying to position now for when hearts get broken.
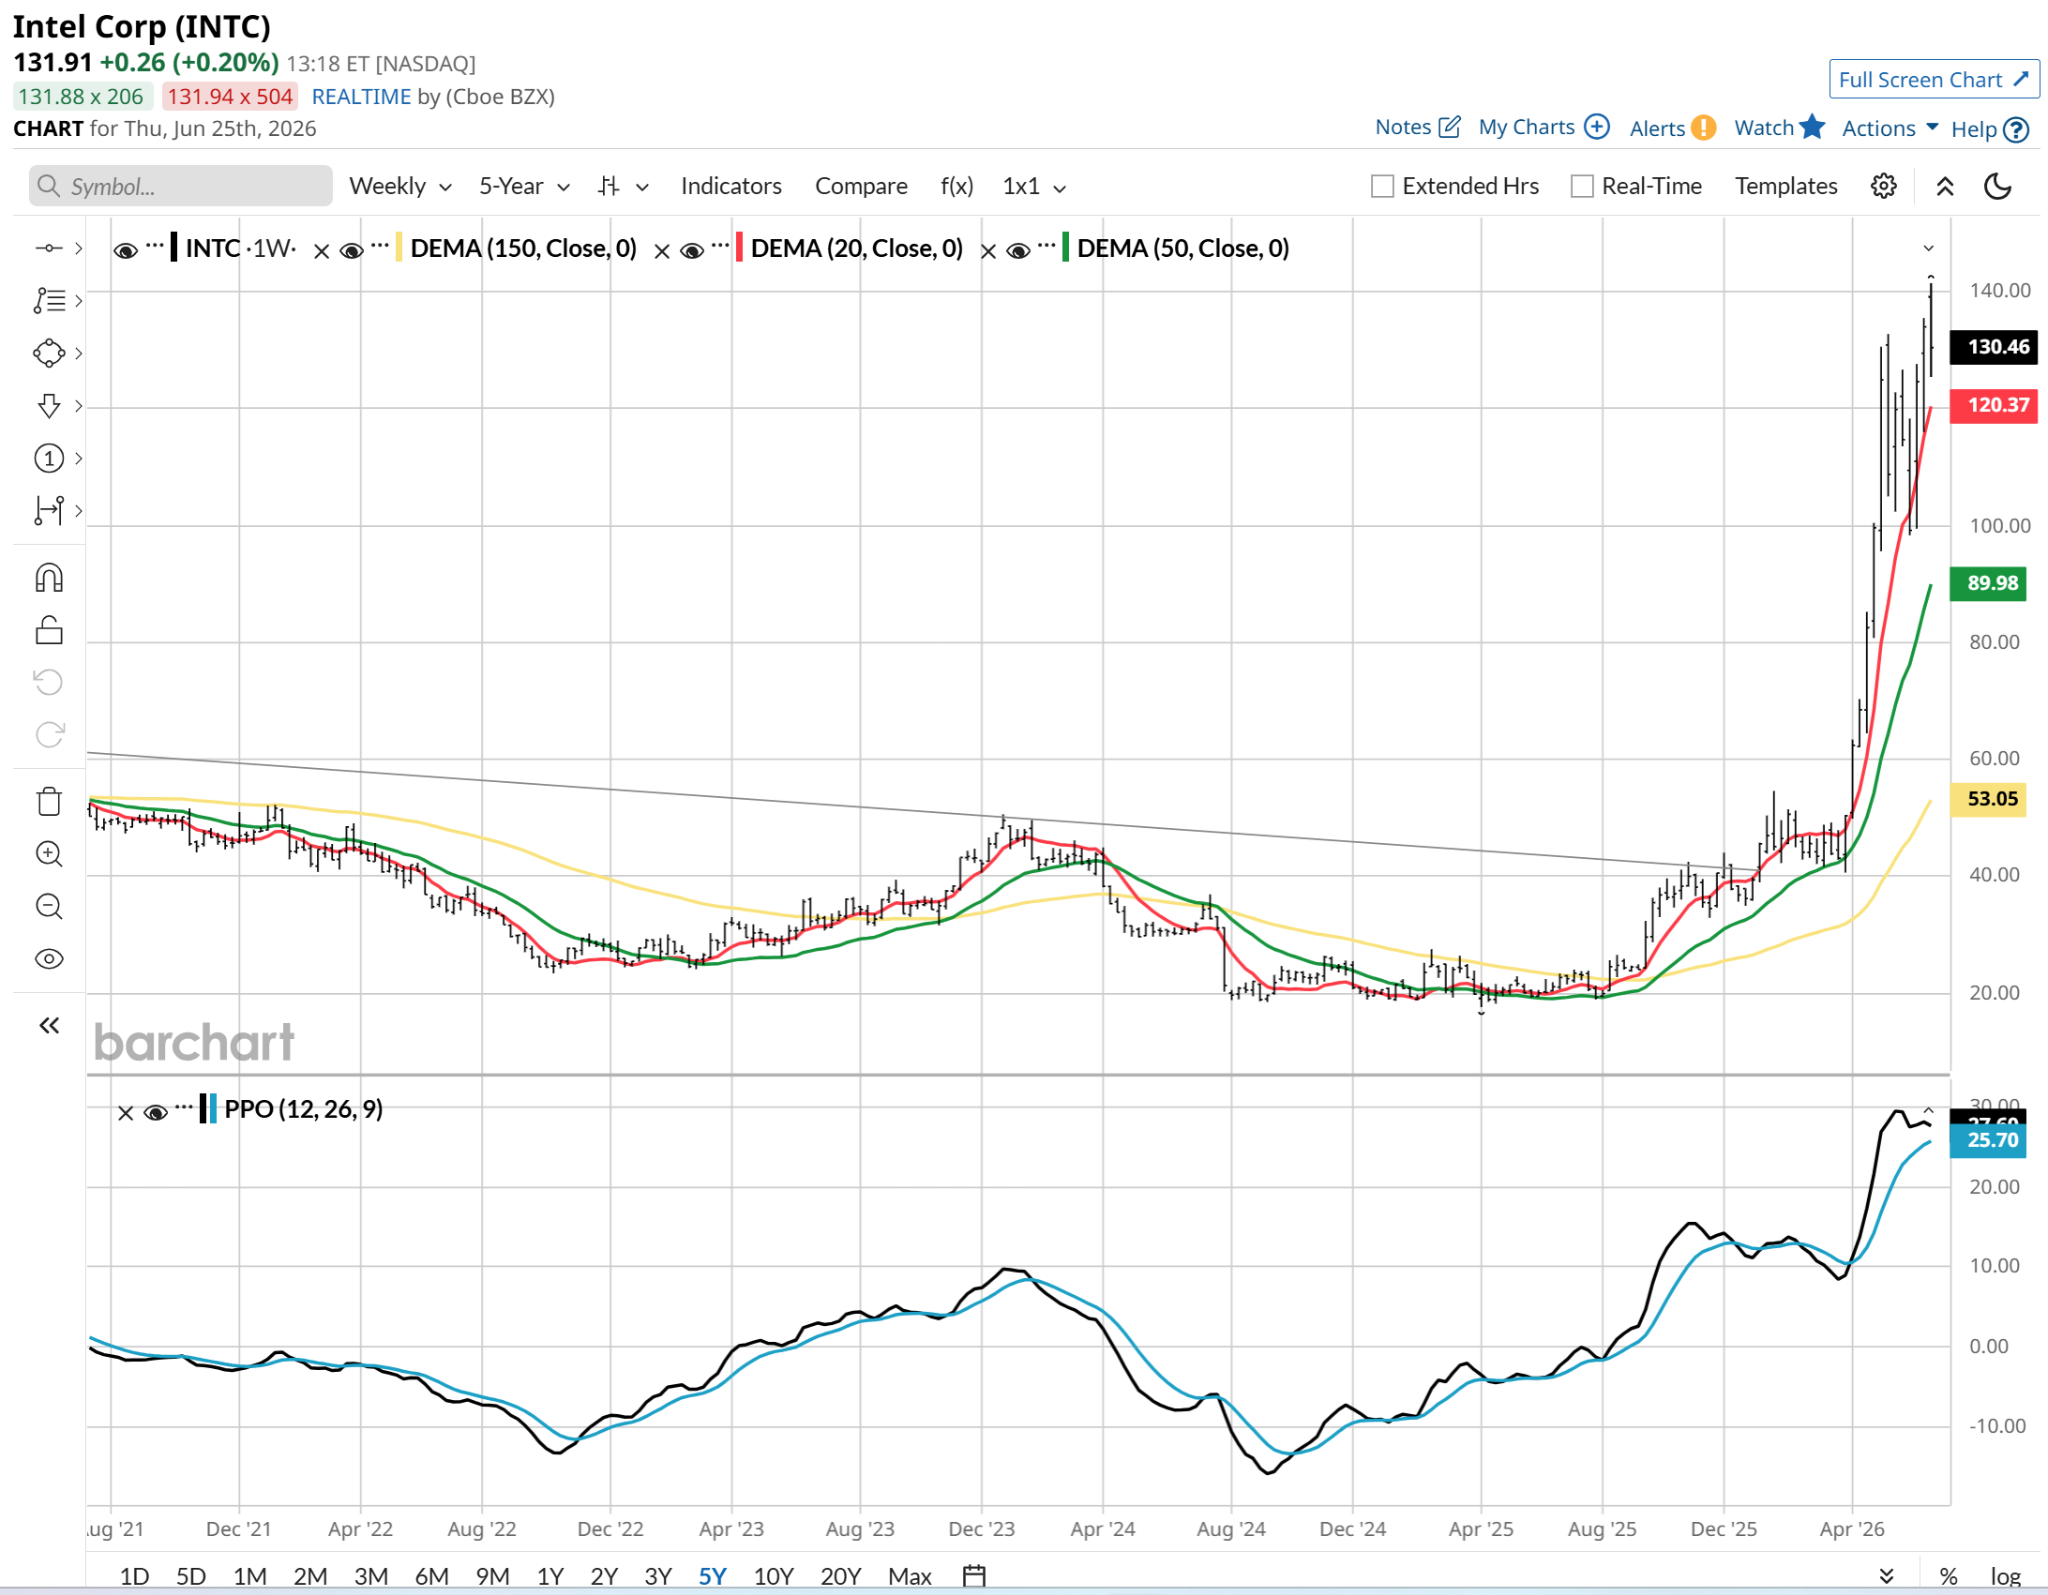
The weekly price chart gives more evidence, which to me is the same thing as confidence. That PPO is historically high and hinting at topping out. What happens after topping out? Rolling over. What can happen after rolling over? A snowball effect, where it really craters. That’s not what I see here in June 2026. But the chance of that occurring by this autumn, early winter, or much sooner is good enough for me to move ahead on this one.
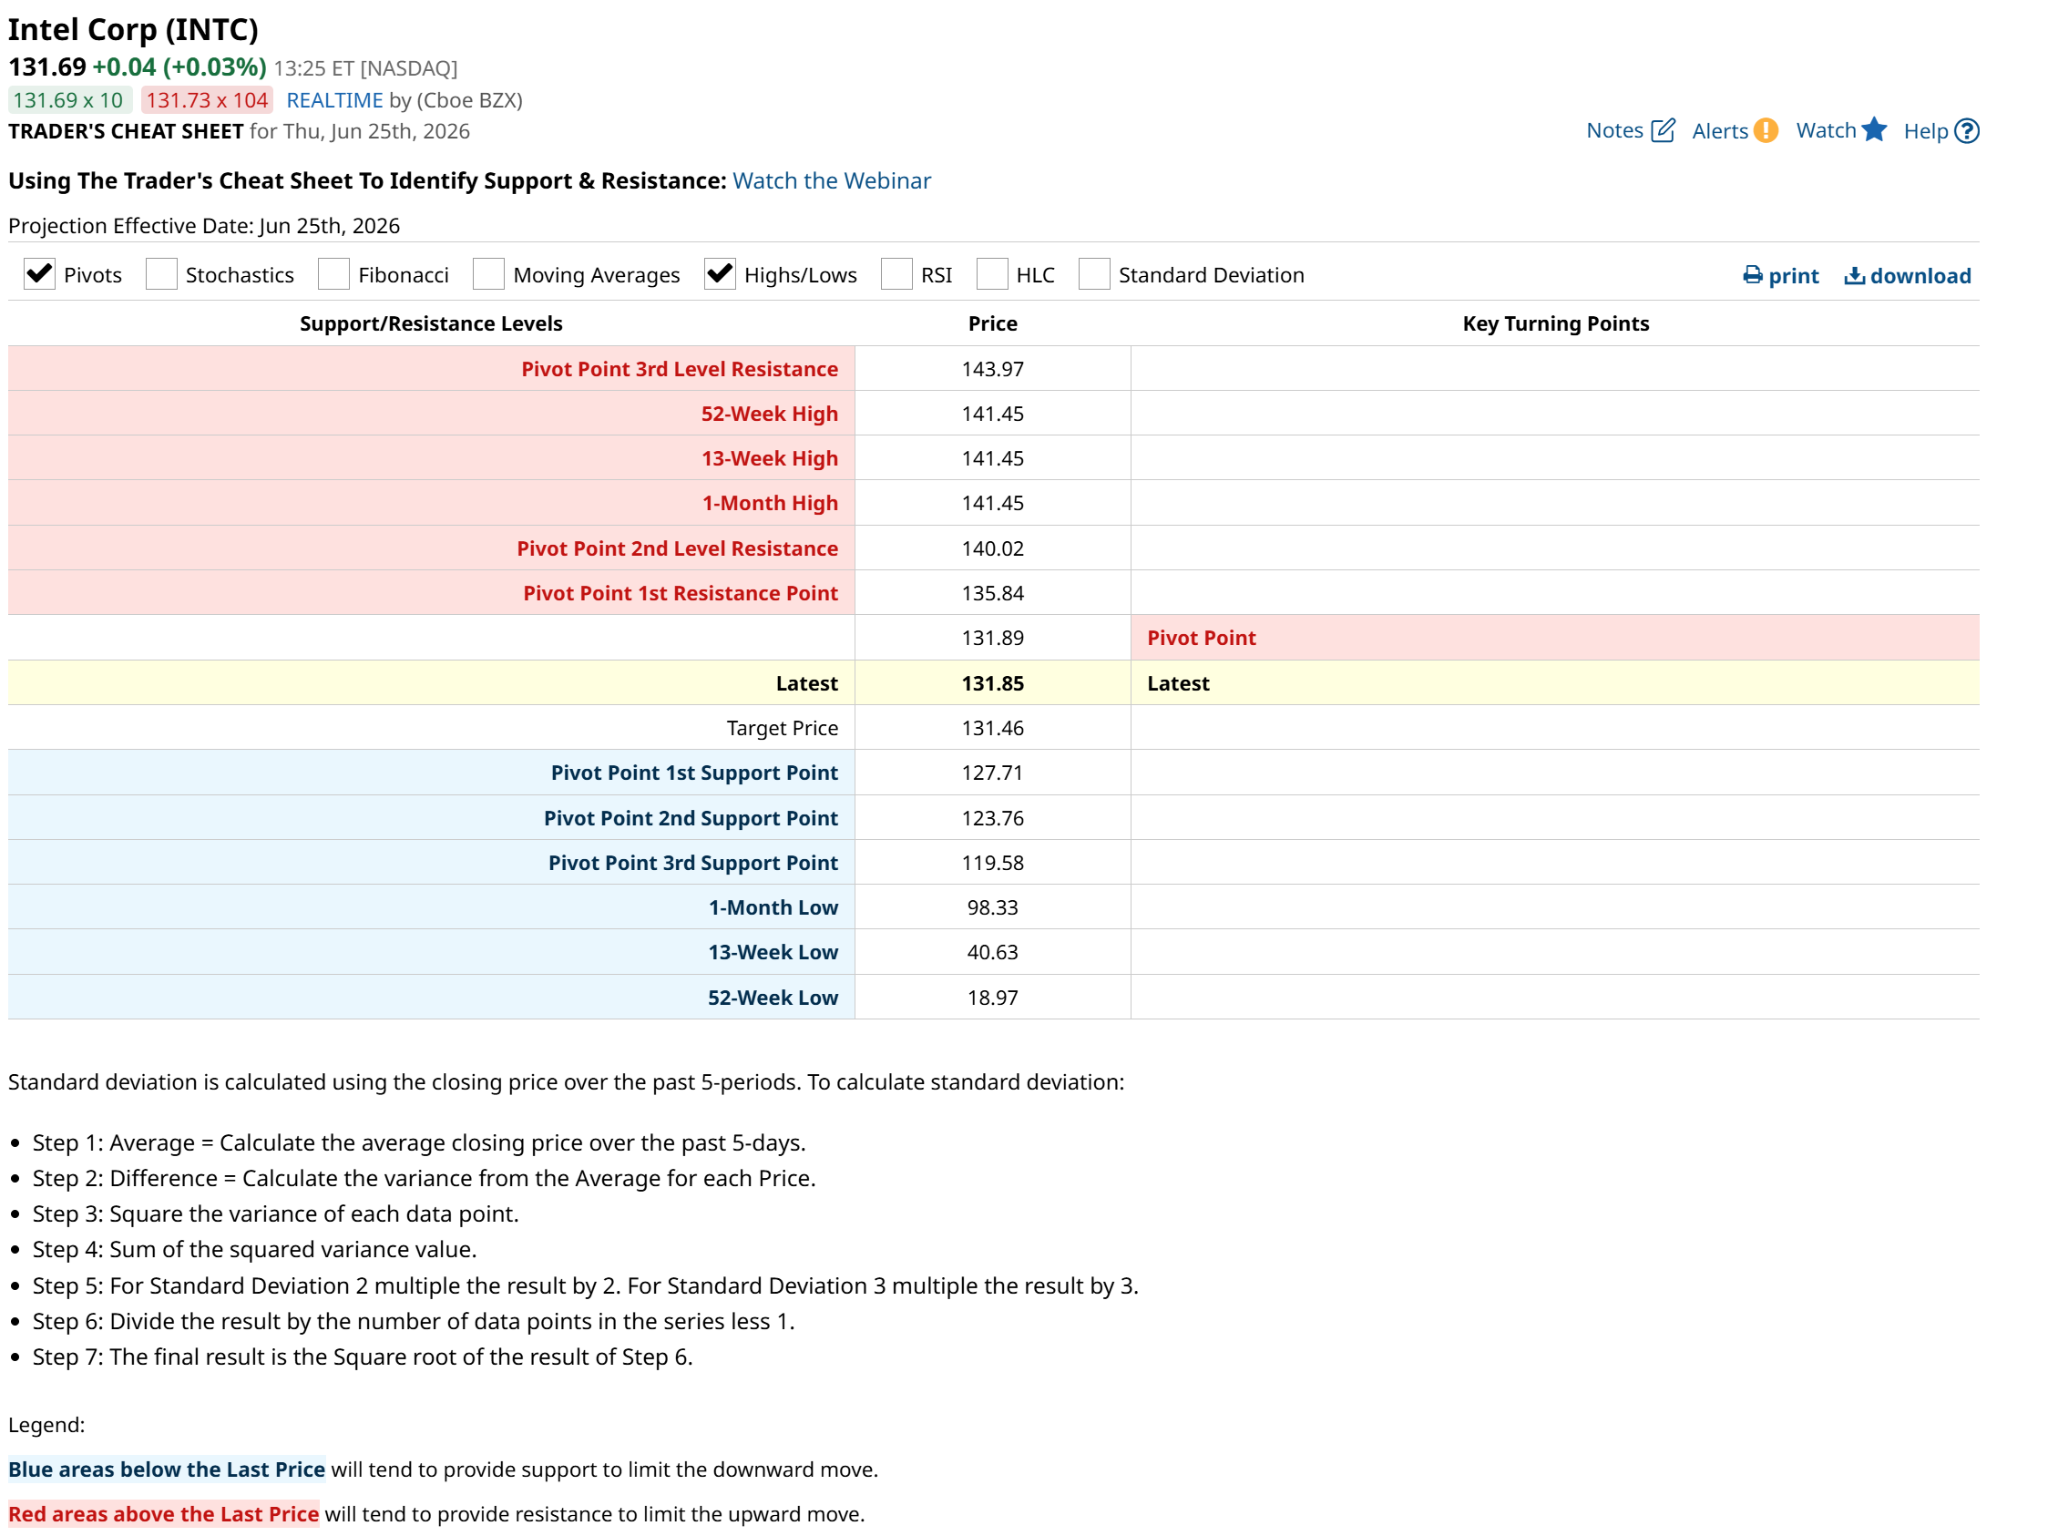
As for price targets, with the stock around $130 as I write this, I’ll note that it was at $100 a very short time ago. So that’s a downside target. But that’s 30% off of the current level, and I don’t want to be too greedy. So I’ll also note the $120 area as a first stop on the way to snowball-ville. And it peaked around $140, so I’ll keep that in mind too. Because not only do markets have a memory, algorithmic trading systems that now dominate daily activity REALLY have a memory.
The next part is deciding on the pricing for the bear collar setup.
There are so many variables involved here, so I’ll keep the pricing simple, and in line with my observations above when scouting the charts for INTC.

- First, I buy 100 shares of INTC, and that costs me around $13,000.
- Next, I sell 1 covered call on INTC, at a strike price of $140, that all-time high level. I’m going out in October to give myself some room. If the stock rockets to a new all-time high before then, I’ll be happy to be forced to sell my 100 shares at $140. And if I’ve changed my mind on INTC, I can trade more shares “long” any time and keep the $22-per-share call option premium in any case. So that’s $2,200 taken in immediately.
- Now the all-important put option. This is where the real “optionality” comes in, depending on how much downside I’m willing to take on. The two things that can screw me here? The stock falls but not nearly to my strike price, which in this example is $100, that recent low. The other thing that can ruin this is if I buy a lot of put contracts, which cost me around $1,000 each, since a contract represents 100 INTC shares, and the options are priced at around $10.
So, let’s recap before I make that put decision.
- I own the stock at a cost of $13,000.
- I sold a call option that brought in $2,200, struck at $140.
- If I left it right there, I’d have an effective upside to $162 = $140 + $22, which is great. That’s $22 above the all-time high and $32 north of here, about a 25% gain before I’d be giving up on more upside, since I’d be at risk of getting the 100 shares of INTC called/taken from me. Not bad!
However, let’s remember why I’m doing this. That call premium’s job is to allow me more “budget” to buy put options, since I think that by October, INTC stock will be much lower. How many puts I pay for at $1,000 a pop depends on how much I want to tip the scales toward “crushing it” on the downside here.
If I buy two put options, I offset my call premium. The calls pay for the puts. However, I have upside to $140, and downside to $100. Buying one option costs me less, but that $100 floor still looms.
So here, I’d buy four put options. I’d spend about $4,000, because if INTC starts descending toward $100, my profit curve will look like a Nike swoosh.
The last point is what happens after the trade is placed. I approach these actively, where every situation is potentially “live” every day. That means that if I start to get what I want, and the stock starts to slide gradually, the calls will sink in price, and I might buy them back.
Among other things, that releases me from the obligation to hold 100 shares. I could sell some of that or even all of it if I want to.
And with the put options, as I see the value of those explode higher, I can lighten my position too.
Once you learn the strategy, and personalize it to your own trading style, focus on the total value of the “position” that started as a bear collar. All I care about in my own portfolio is what the value is. If I have an account with $100,000 in it, I have a set of guardrails around that $100,000. I do everything in my power to keep its value at $95,000 or higher at all times – meaning, I won’t have more than 5% of my total capital at risk. And as the account’s value climbs, I can take some off the table, either to reinvest or to pad my lifestyle.
Hunting for bear…collars
Options are only as risky as you want them to be, provided you execute with a premeditated plan of attack. By structuring a collar with a multilayered put framework, you eliminate un-hedged downside disaster and give yourself a mathematical edge. I am OK letting the crowd chase the vertical charts and buy into the hype. As an active risk manager, my priority is the structure, setups, and hard risk parameters to turn market volatility into profit.
Jargon alert: the word I’ve tried to avoid using here is “convexity.” However, that is the driver, in financial terms. Convexity simply means you are wagering a little to try to achieve a less likely outcome. But I use those cheaper put options as the impetus to buy more of them than I own stock. Because remember, my investing outlook is that INTC falls significantly over the next four months.
Before you start trading, you must have a plan. And that starts with deciding what “winning” and “losing” look like, in dollar terms, and over what time frame. Because as boxing legend Mike Tyson famously said, “everyone has a plan… until they get punched in the face.”
Next time I get punched, I still want to be able to take the stairs all the way down, slowly, and one at a time.
On the date of publication, Rob Isbitts did not have (either directly or indirectly) positions in any of the securities mentioned in this article. All information and data in this article is solely for informational purposes. For more information please view the Barchart Disclosure Policy here.
/Micron%20Technology%20Inc_%20logo%20on%20building-by%20vzphotos%20vis%20iStock.jpg)

/AI%20(artificial%20intelligence)/AI%20engineer%20working%20on%20laptop%20by%20ART%20STOCK%20CREATIVE%20via%20Shutterstock.jpg)

/A%20corporate%20office%20for%20IBM%20by%20HJBC%20via%20Adobe%20Stock.jpeg)