Grains
The charts below are key to this analysis.
In our Update on 10/3/24 we mentioned the following,
The current rallies are showing signs of life in Soybeans, Corn and Wheat, however they have all run into key retracements above. In Soybeans it is a 23.6% retracement, in Corn it is a combination of 23.6% and 38.2% and in Wheat it is 38.2%. We will be watching the 38.2% levels on any setback to see if the trends will continue.
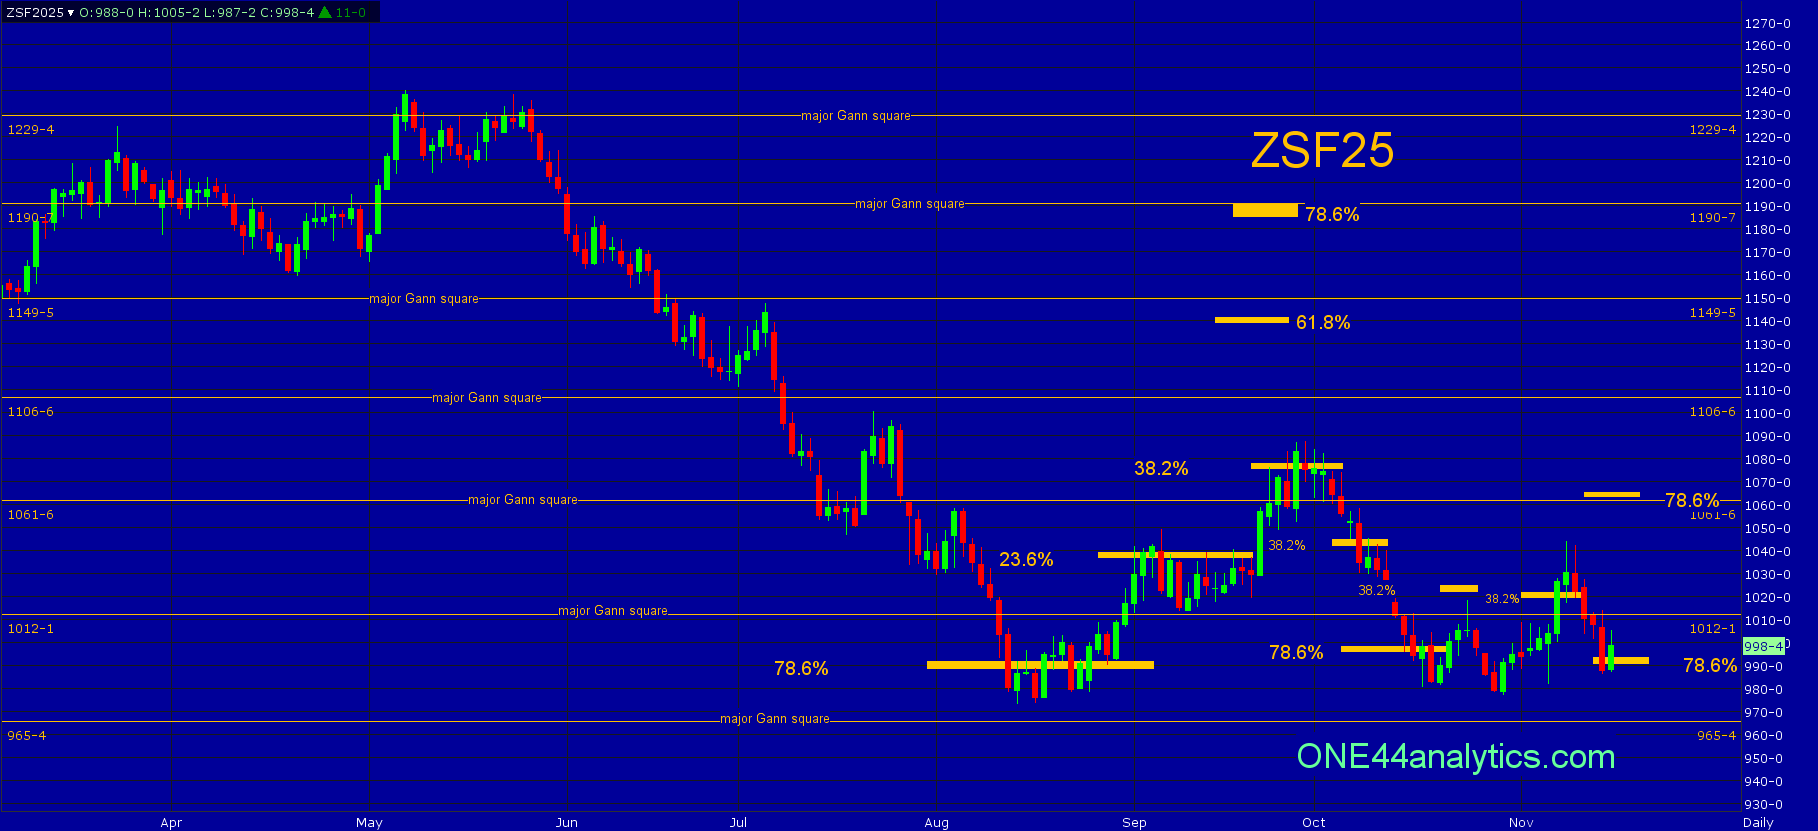
Soybeans
It traded at 1055.00 all week. It was unable to get a couple solid closes above it and there was no follow through on the downside. A setback from 1055.00 can still send this market to a new low, or a good test of it, so we will be watching the 78.6% level as a target. The 38.2% level below will be key to the rally continuing, just as it was at 1002.00.
Use 1055.00 as the swing point for the week again.
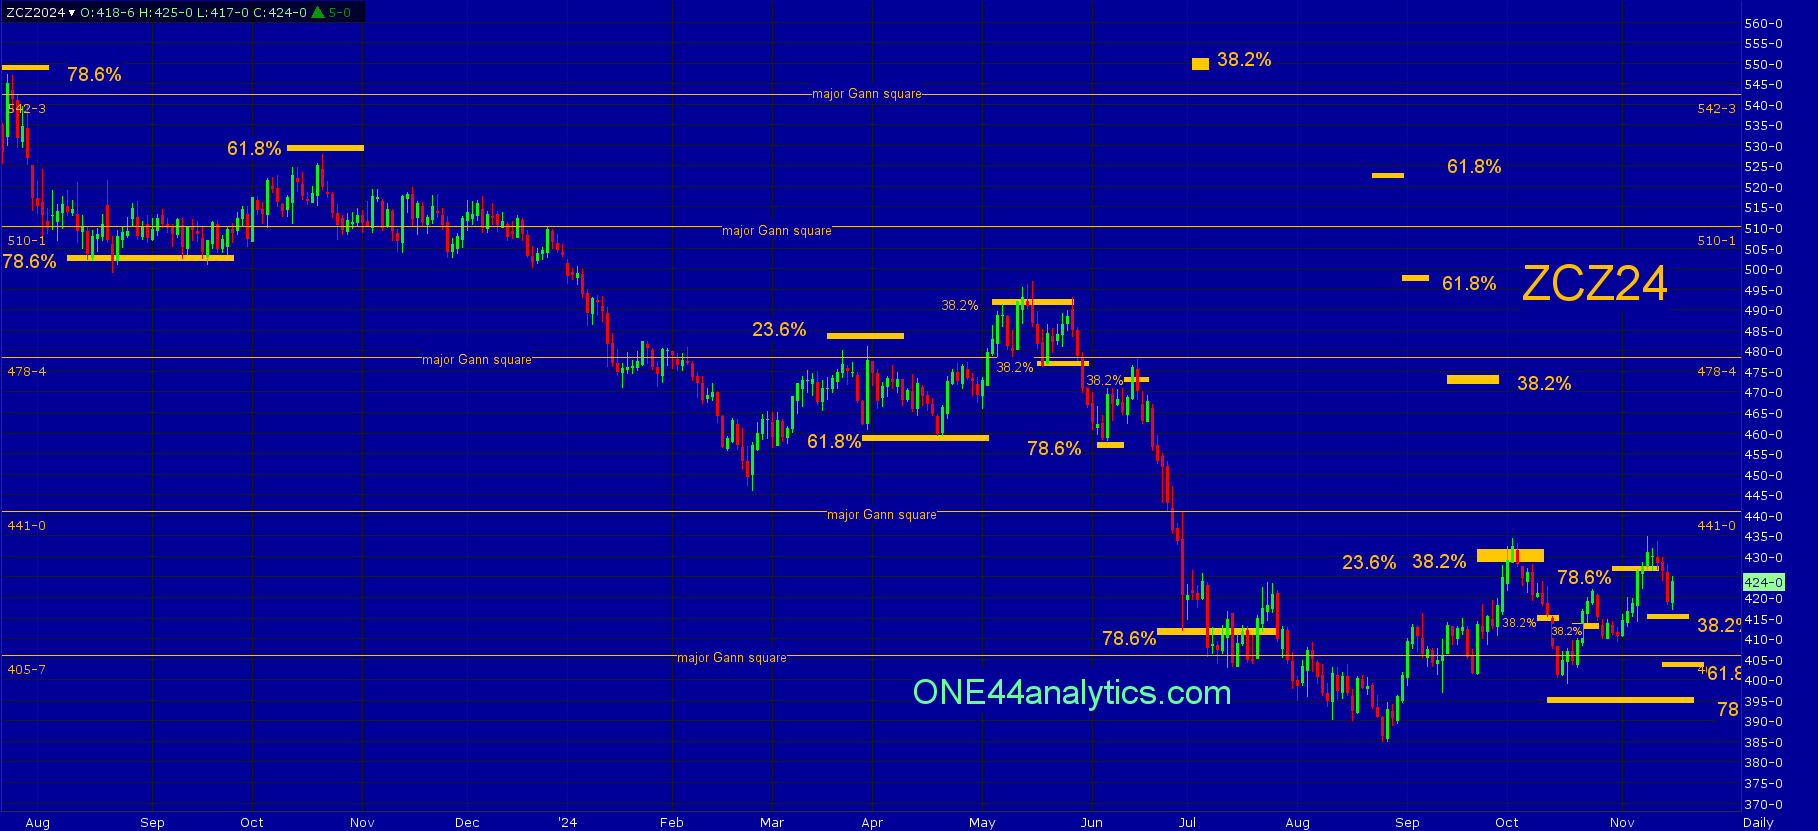
Corn
This week's rally took it to the short term target of 429.00 (23.6%/38.2%), it has one close above it and it needs another to turn the intermediate trend positive. A setback back from here can send it to a new low, or a good test of it. We will now watch 38.2% below to see if the short term trend can remain positive.
Use 429.00 as the swing point for the week.
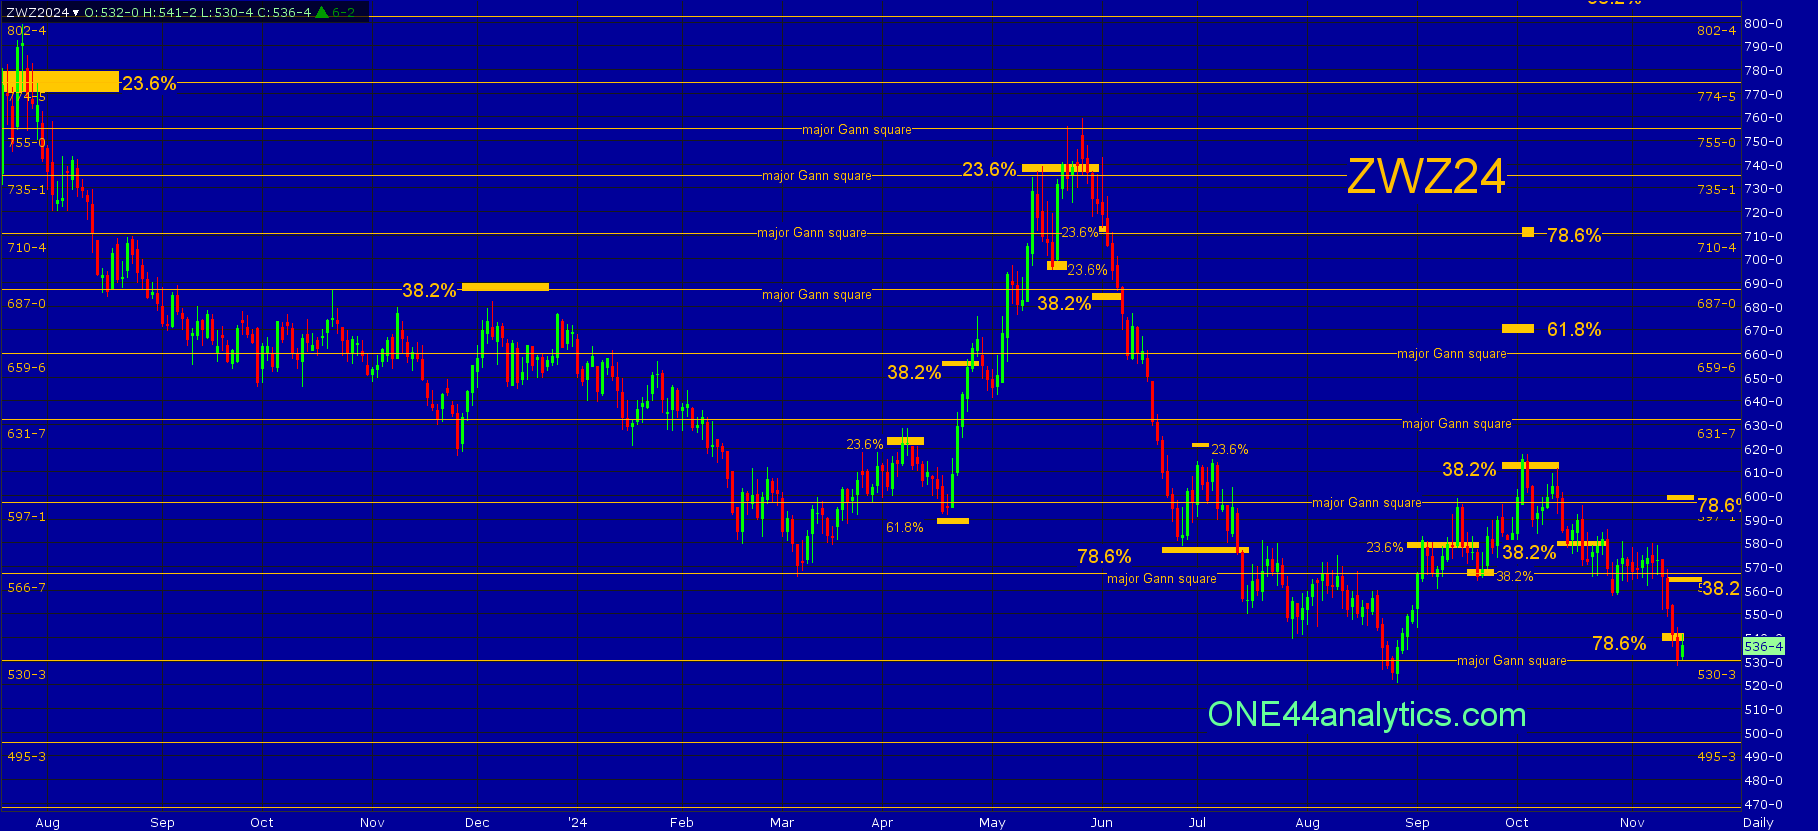
Wheat
This week's rally hit the short term target of 612.00 and it has one close above it, but today closed right back below it, this is the level that needs to come out to turn the Intermediate trend positive. We will be watching the 38.2% level on any setback to see if the short term uptrend can continue, just like it did at 566.75 on 9/19/24.
Use 612.00 as the swing point for the week.
NOW,
As you can see on the charts all three of these markets were sent lower by key longer term retracements. We said based on the ONE44 Fibonacci rules and guidelines that these levels can send them to new lows for the move, however we watch all the retracements on every move to see just how weak, or strong the markets are regardless of the longer term target.
This is where the stand now,
January Soybeans came off hard, it took out 38.2% at 1044.00 and 78.6% at 997.00, but has not taken out the 8/14/24 low yet. It currently hit another 78.6% retracement at 992.00, it had one close below it, but we always want to see two to violate the level and Friday it close back above it.
We are using 992.00 as the swing point for this week. Above it, look for the area of the 1061.75 major Gann square and 78.6% back to the 9/30/24 high at 1064.00. Below it, look for the next major Gann square at 965.50.
December Corn is in the strongest position of the three Grains. The setback from combination of retracements on 10/2/24 failed to make a new low and held above 78.6% back to the low at 396.00. The rally from there made a slightly higher high and we are now watching 38.2% to see if the short term trend can stay positive.
Use 416.00 as the swing point for the week. Above it, look for the 441.00 major Gann square. Below it, look for the area of the 405.75 major Gann square and 61.8% back to the low at 404.00.
The setback in December Wheat from 611.00 (38.2%) has yet to make a new low and now has a couple closes below 78.6% at 541.00, this level is key for the next week.
Use 541.00 as the swing point for the week. Above it, look for 38.2% back to the 10/2/24 high at 566.75, this is also a major Gann square. Below it, look for the next major Ganns square at 495.25.
We have done 44 videos on how to use the Fibonacci retracements with the ONE44 rules and guidelines. These Videos are worth watching even if it is not in the market you are trading, as the ONE44 rules and guidelines are the same for every market. You will also see why we believe the Fibonacci retracements are the underlying structure of ALL markets.
.
ONE44 Analytics where the analysis is concise and to the point
Our goal is to not only give you actionable information, but to help you understand why we think this is happening based on pure price analysis with Fibonacci retracements, that we believe are the underlying structure of all markets and Gann squares.
If you like this type of analysis and trade the Grain/Livestock futures you can become a Premium Member.
You can also follow us on YouTube for more examples of how to use the Fibonacci retracements with the ONE44 rules and guidelines.
Sign up for our Free newsletter here.
FULL RISK DISCLOSURE: Futures trading contains substantial risk and is not for every investor. An investor could potentially lose all or more than the initial investment. Commission Rule 4.41(b)(1)(I) hypothetical or simulated performance results have certain inherent limitations. Unlike an actual performance record, simulated results do not represent actual trading. Also, since the trades have not actually been executed, the results may have under- or over-compensated for the impact, if any, of certain market factors, such as lack of liquidity. Simulated trading programs in general are also subject to the fact that they are designed with the benefit of hindsight. No representation is being made that any account will or is likely to achieve profits or losses similar to those shown. Past performance is not necessarily indicative of future results.
On the date of publication, Nick Ehrenberg did not have (either directly or indirectly) positions in any of the securities mentioned in this article. All information and data in this article is solely for informational purposes. For more information please view the Barchart Disclosure Policy here.

/AI%20(artificial%20intelligence)/AI%20microchip%20by%20DesignKingBD360%20via%20Shutterstock.jpg)


/A%20Palantir%20office%20building%20in%20Tokyo_%20Image%20by%20Hiroshi-Mori-Stock%20via%20Shutterstock_.jpg)