Hello everyone! In today’s article, we will follow up on the past performance of Adobe Inc. (ADBE) forecast. We will also review the latest daily count. First, let’s take a look at how we analyzed it back in March 2024.
$ADBE Daily Elliott Wave View – March 2024:
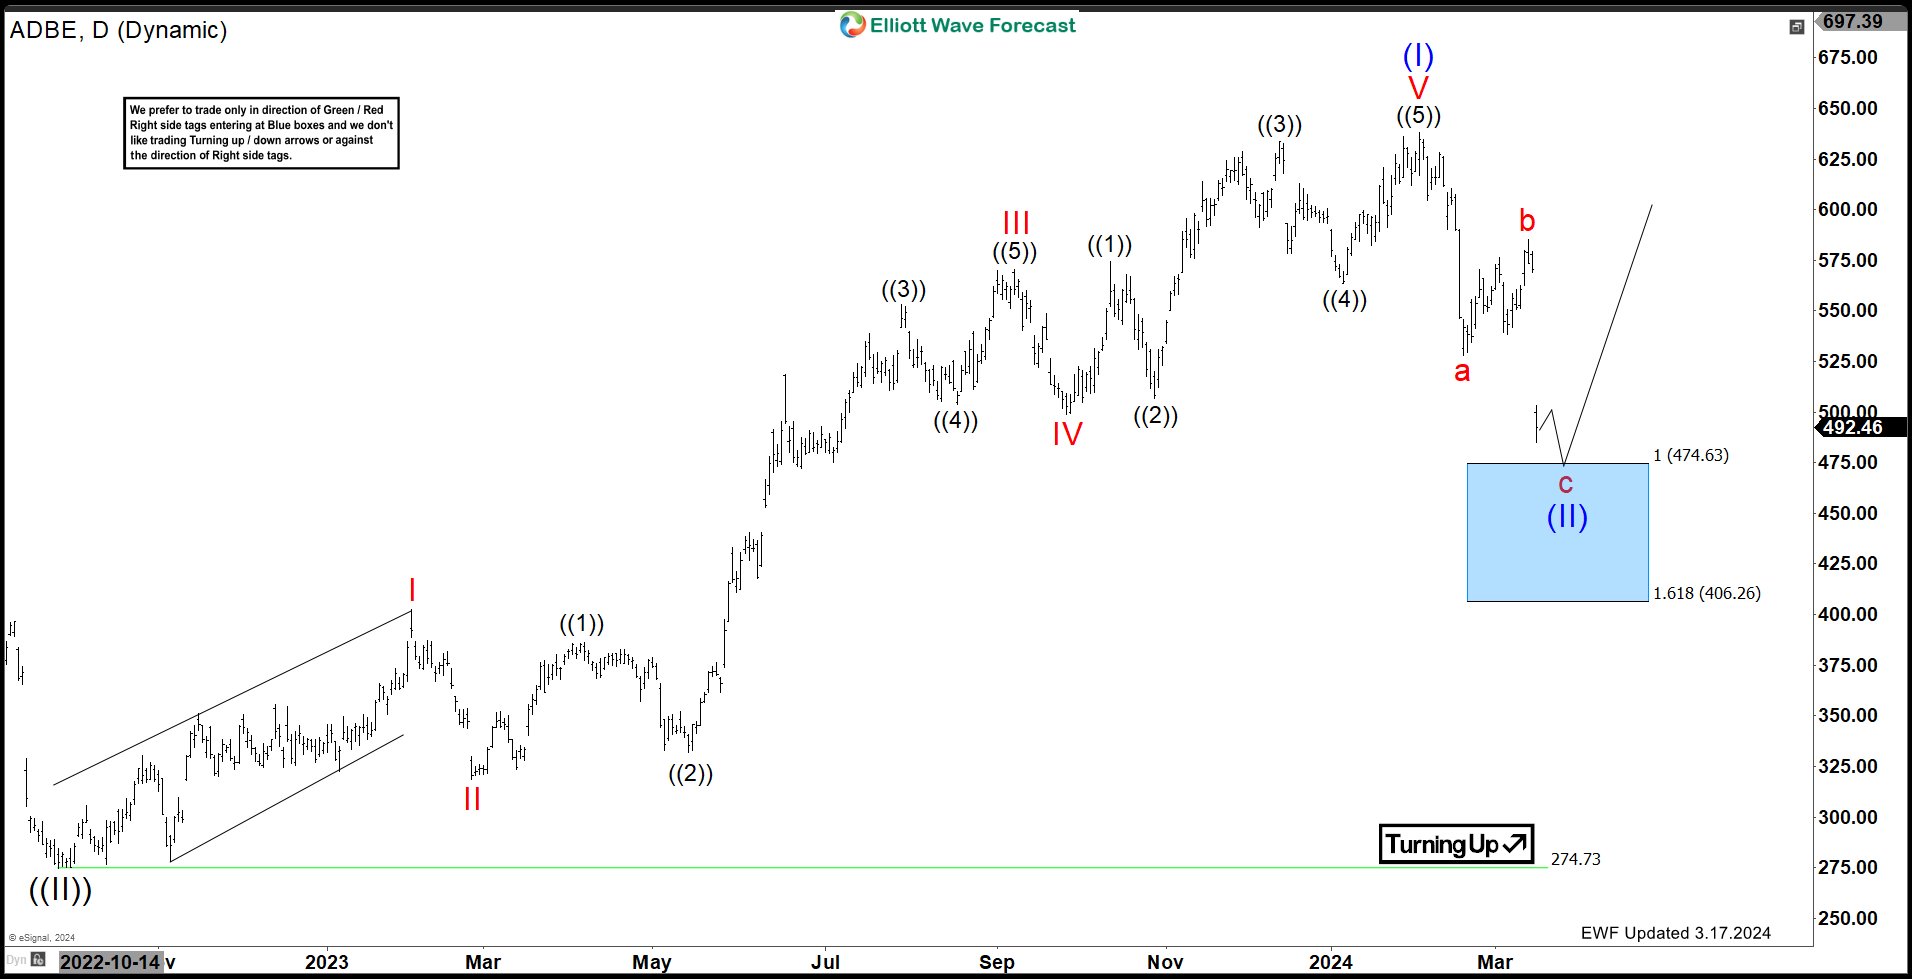
In our last article, we explained that $ADBE was about to reach the Blue Box area at $474.63 – $406.26. A bounce was anticipated at these levels. This area was a critical support zone identified by our proprietary Elliott Wave analysis.
$ADBE Daily Elliott Wave View – July 15, 2024:
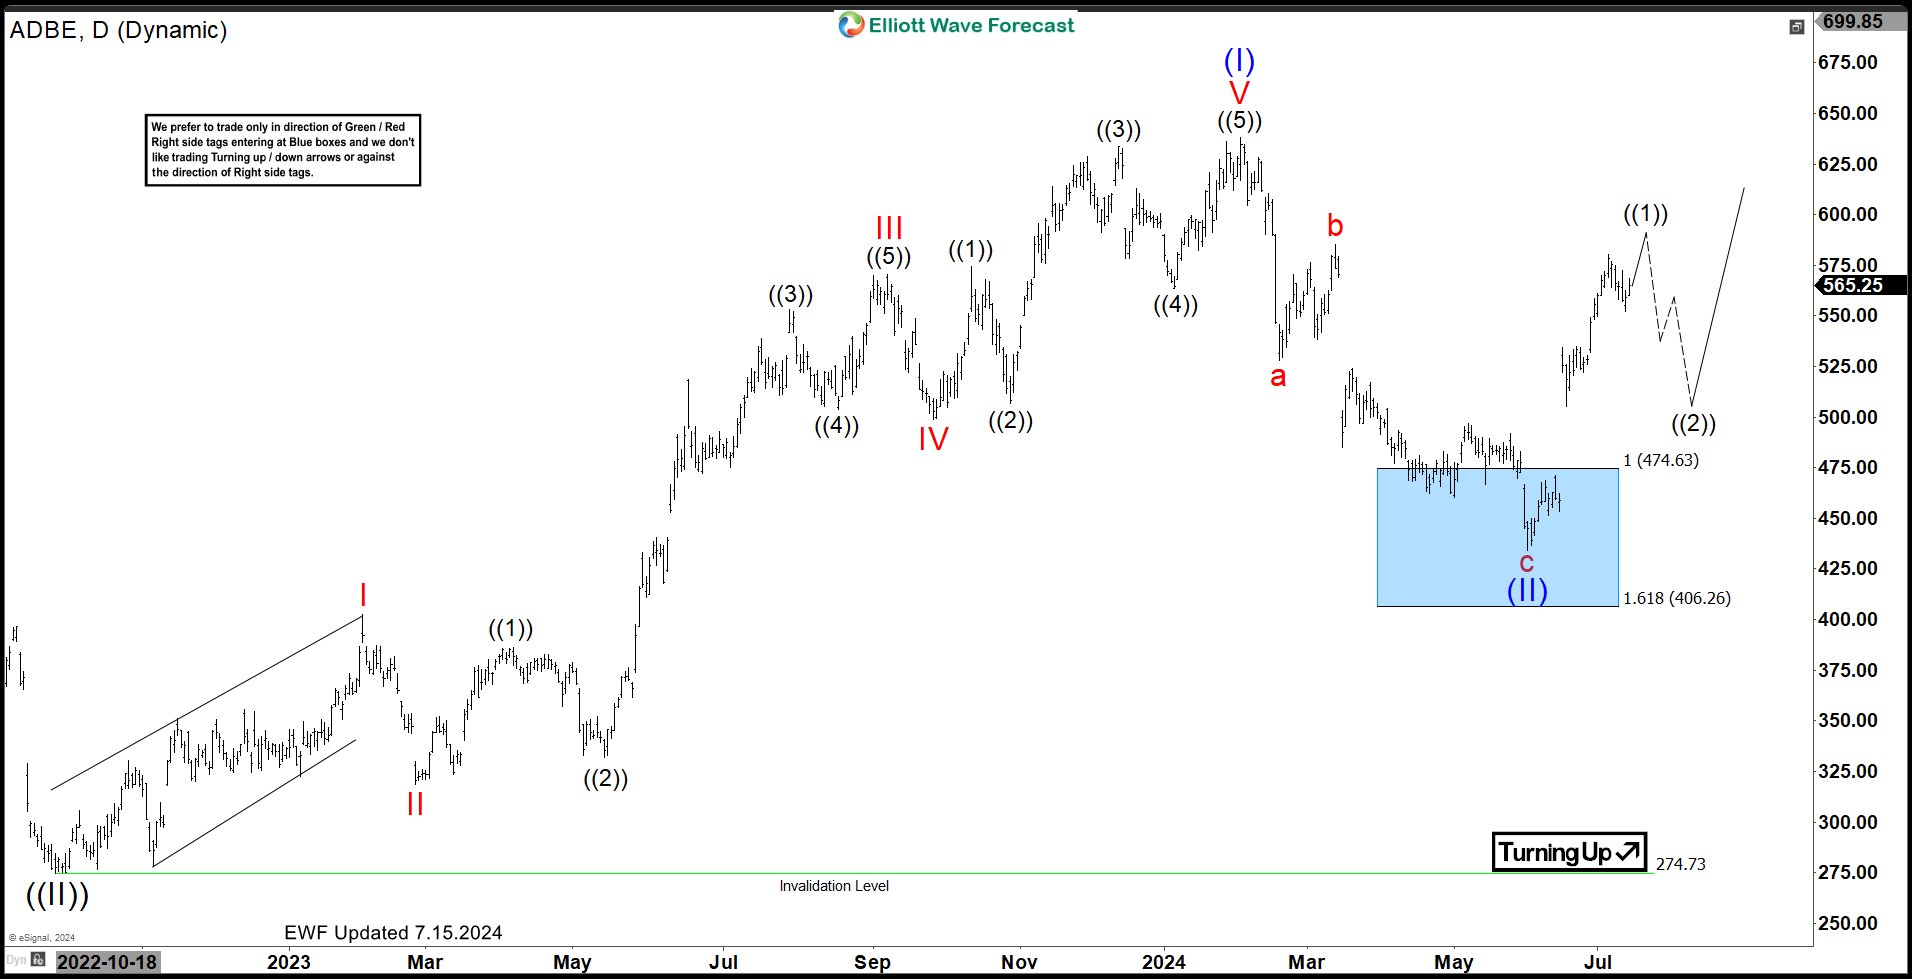
The latest daily update confirms that $ADBE has ended the cycle lower after bouncing from the Blue Box area. As a result, the stock has moved higher, allowing long positions to become risk-free. We expect $ADBE to rally in one more push to make a 5-wave pattern before another pullback occurs. Traders should look for re-entry opportunities at black ((2)) in 3 or 7 swings. Moreover, a break above the all-time highs (ATHs) will start a bullish sequence towards the $797 – $1021 range.
Source: https://elliottwave-forecast.com/stock-market/riding-wave-adbes-impressive-rally-whats-coming-next/
On the date of publication, Elliott Wave Forecast did not have (either directly or indirectly) positions in any of the securities mentioned in this article. All information and data in this article is solely for informational purposes. For more information please view the Barchart Disclosure Policy here.

/A%20corporate%20sign%20for%20SK%20Hynix%20by%20Tada%20Images%20via%20Adobe%20Stock.jpeg)

/2d%20illustration%20of%20Cloud%20computing%20by%20Blackboard%20via%20Shutterstock.jpg)
/Server%20racks%20by%20dotshock%20via%20Shutterstock.jpg)