/A%20close-up%20of%20a%20General%20Motors%20corporate%20sign%20by%20lindaparton%20via%20Adobe%20Stock.jpeg)
Everybody’s familiar with the old adage, buy low and sell high — that’s what we’re all here to do. However, this well-meaning sentiment is easier said than done. Still, if you’re looking for a quick buck over the next several weeks, automotive giant General Motors (GM) should be on your radar.
No, in a world of tech juggernauts delivering solutions for artificial intelligence and other advanced innovations, General Motors isn’t exactly the sexiest idea out there. However, GM stock offers something to think about. Over the trailing year, the automaker has enjoyed a 64% lift in market value. Further, Barchart’s Technical Opinion indicator rates GM as a 72% Strong Buy.
In that sense, the recent slowdown in momentum could offer a contrarian opportunity for options traders. During the past month, GM stock dipped 1%. Since the beginning of the year, it’s down nearly 3%. These metrics suggest that General Motors merely ran over some potholes — an annoyance but hardly worth fretting about. Given that the broader picture appears resilient, speculators may consider buying the dip.
However, dip-buying shouldn’t be a haphazard process. This is where the previously mentioned adage can become a liability. After all, if successful investing were simply about buying red-stained securities, everybody would do it. Obviously, it doesn’t work that way. So, we need a more strategic approach.
One methodology is to measure conditioned performance variances relative to a random baseline. If the equities market were truly random, we would expect forward returns to be roughly the same — irrespective of whether we bought GM stock in a bearish cycle, bullish cycle or an aggregate of all cycles. However, extensive research reveals that securities respond differently based on their surrounding environment.
That's not a controversial point as we instinctively believe this to be true. But the beauty of the current digital paradigm is that we can go beyond trading with our instinct and empirically measure these performance variances.
Laying Down an Inductive Framework for GM Stock
One of the immense challenges of analyzing the equities market is that the system is non-deterministic. Simply stated, the answer to our problem has not yet materialized. Worse yet, there is no single, correct answer because the end result has not yet been determined.
From a mathematical standpoint, we come across a paradox in that the more evidence we gather for our investment thesis, the less likely all the components that make up the thesis will come true simultaneously. Because the event that we’re forecasting hasn’t been realized yet, the evidence that we gather are really assumptions — and assumptions from a probabilistic standpoint are multiplicative rather than additive.
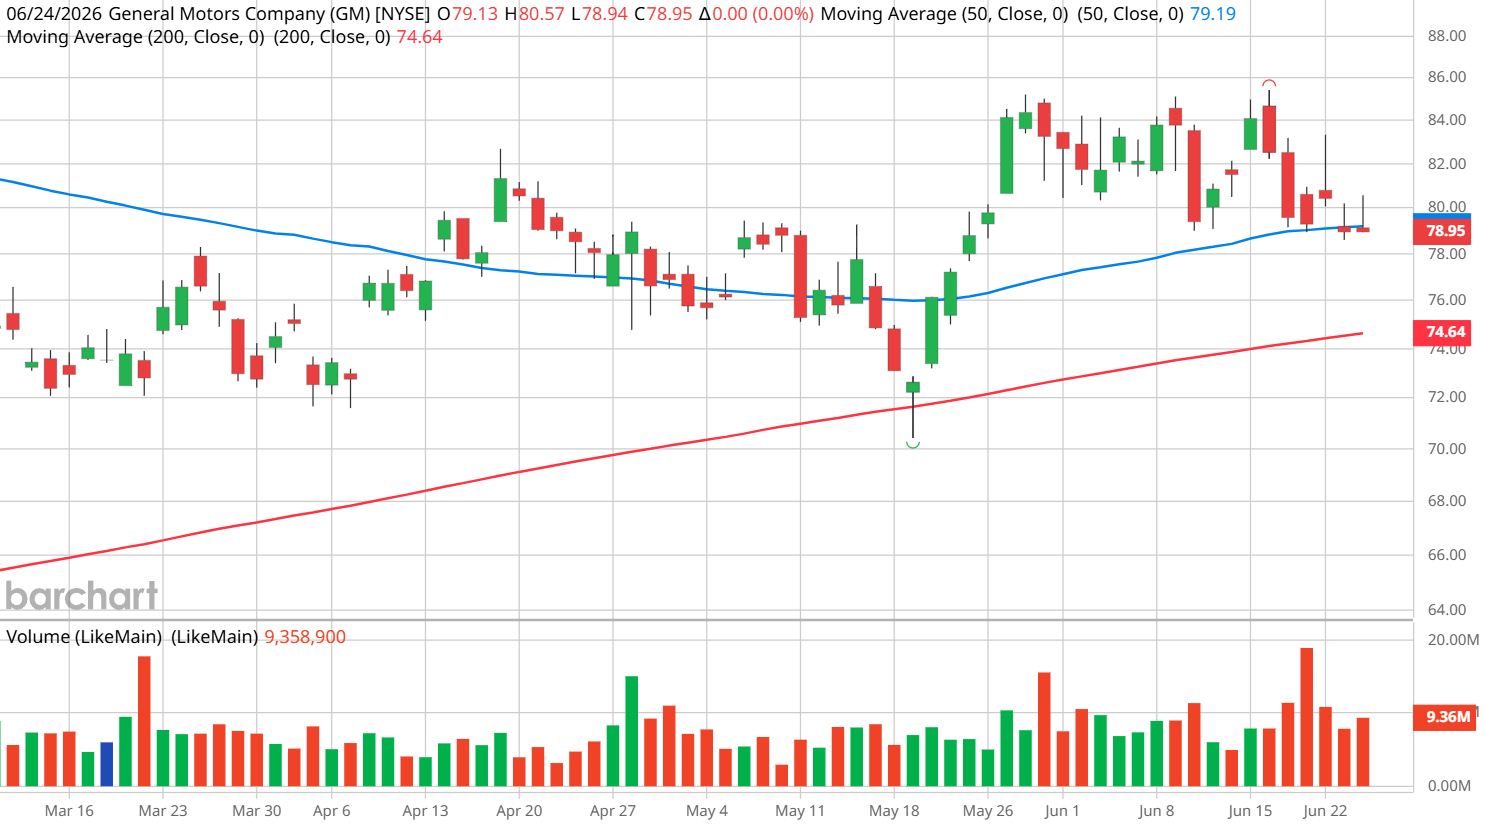
As such, the only truth that we can reliably depend on is the share price. As of Wednesday’s close, the market has determined that GM stock is worth $78.95. Any other inference — such as whether GM is undervalued or overvalued at this price — is a presupposition, not a fact.
While we can’t absolutely determine the forward value of GM stock, we can figure out how the environment in which GM trades tends to affect its forward performance. It’s the same principle that Amazon (AMZN) uses to predict consumer behavior. Amazon isn’t guessing what you’re going to buy. Instead, they look at underlying trends — such as weather reports — that reliably catalyze purchases of particular items.
Let’s consider buying GM stock randomly, with an intention to hold for a 10-week period. At the end of the 10 weeks, an investor can expect a forward outcome ranging between $78 and $82.50 (assuming a starting price of $78.95 and using a dataset going back to January 2019). Generally speaking, GM enjoys an upward bias.
However, we’re not interested in buying shares randomly but purposefully. In the last 10 weeks, GM stock has printed only three up weeks, leading to a downward slope (fading momentum). Under this specific signal, GM’s forward 10-week distribution would be expected to range between $72 and $92. In other words, while there’s an expansion of risk, the upside reward potential has also widened considerably.
It Has Happened Before
You might be skeptical about the above methodology and frankly, you should be. Inductive models are inferred through observations. But this doesn’t mean that a stock must follow the trend of prior observations. Still, my argument is that similar environmental conditions tend to generate similar forward responses.
We can look back at GM stock in late April. As I wrote at the time, GM flashed the exact same quantitative signal that I’m talking about today. Given prior trends, I suggested that the 82.50/85 bull call spread expiring June 18 was worth considering. Sure enough, GM got pretty close, closing at $84.35 on May 28 and $84.07 on June 15.
Yes, you can call it pattern recognition, which can be misleading due to overfitting, post-hoc rationalizations and other biases. Nevertheless, in the absence of certainty, using an inductive approach may be the best tool that we have for exploiting short-term trading opportunities.
If you believe in the concept, aggressive speculators may consider the 82.50/85 bull call spread expiring Aug. 21. If lightning strikes twice, the $85 target falls within the expected forward distribution, making it a realistic proposition within the framework.
On the date of publication, Josh Enomoto did not have (either directly or indirectly) positions in any of the securities mentioned in this article. All information and data in this article is solely for informational purposes. For more information please view the Barchart Disclosure Policy here.

/Oracle%20Corp_%20office%20logo-by%20Mesut%20Dogan%20via%20iStock.jpg)
/Micron%20Technology%20Inc_%20logo%20on%20building-by%20vzphotos%20vis%20iStock.jpg)

/Boeing%20Co_%20sign%20at%20airport-by%20sanfel%20via%20iStock.jpg)