/General%20Motors%20Company%20phone%20and%20pump%20by-%20Below%20the%20Sky%20via%20Shutterstock.jpg)
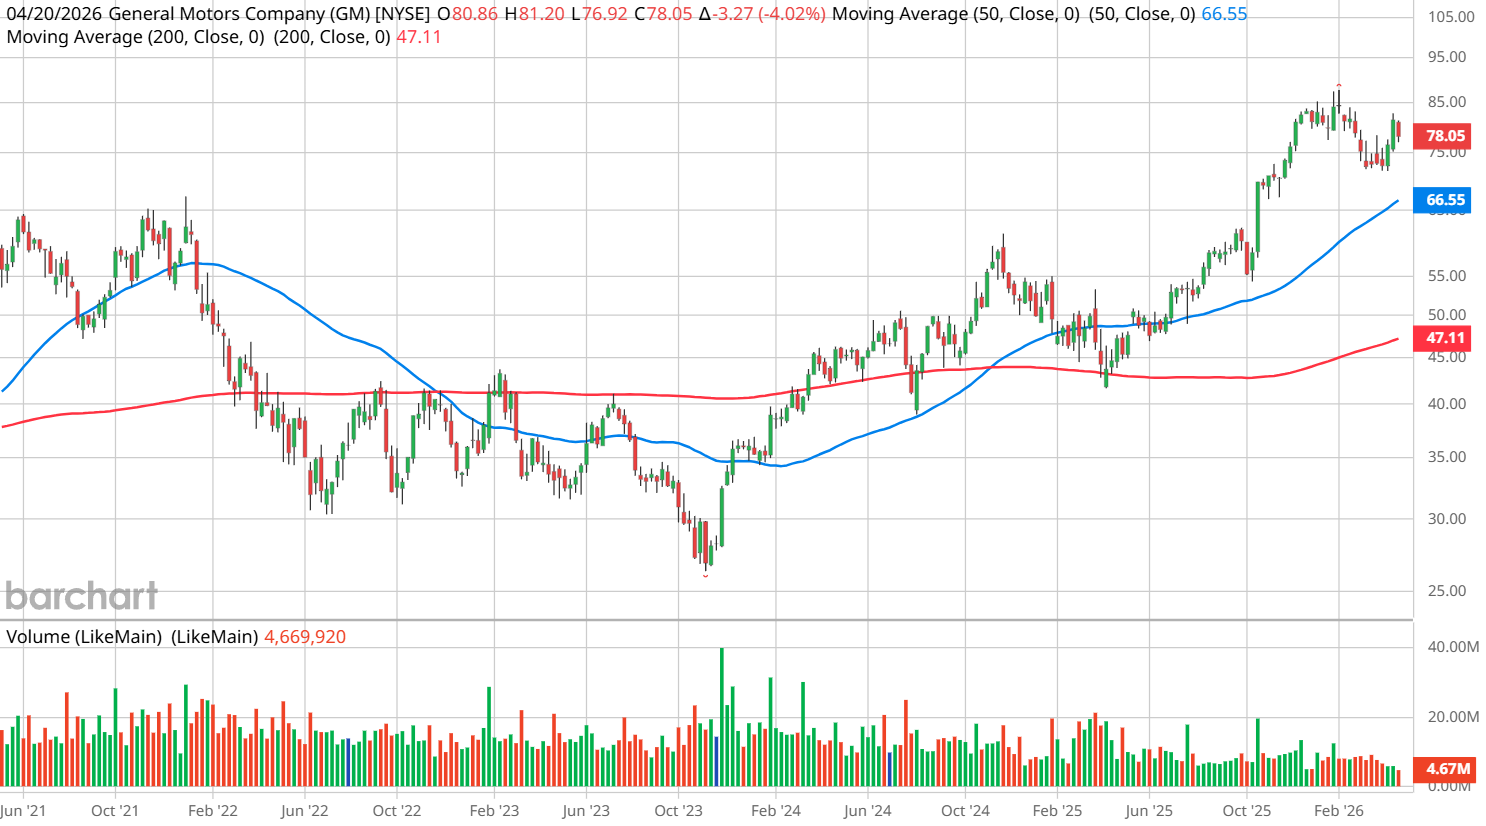
When it comes to risky wagers in the equities market, General Motors (GM) is arguably among the names in the spotlight. On the surface, GM stock — being an American icon and all — seemingly presents a solid platform to park one’s money for the long term. However, it’s not really off to a great start this year, with the security losing 4% on a year-to-date basis.
Some of the volatility is completely understandable, particularly the uncertainties surrounding the Iran conflict. But there are structural concerns that predate the geopolitical flashpoint that put potential strain on GM stock. For example, an Associated Press report earlier this month revealed that many consumers are struggling as the average cost of a new car nears $50,000.
Another problematic issue for the sector itself are datapoints that suggest momentum for electric vehicles is fading. While it may not be the time to hit the panic button on EV integration trends, the harsh reality is that several automakers have invested considerable capital toward the electrification of mobility. If this anticipated development doesn’t pan out, that may leave a lot of companies holding the bag.
Given this context, General Motors recently announcing that its indefinitely suspending its next-gen electric truck could actually be a positive catalyst for GM stock. Essentially, the automaker is focusing on what consumers currently want — and what it’s an expert at delivering.
Moreover, the upcoming first-quarter earnings report — scheduled for April 28 before the opening bell — may provide an additional boost to GM stock. On paper, the automaker is expected to print earnings per share of $2.61 on revenue of $43.82 billion. It has a string of positive performances so another beat wouldn’t be out of the question. Plus, if GM’s strong 2026 guidance is reaffirmed or lifted, that could offer a nice tailwind.
Using an Inductive Approach to Analyze GM Stock
While the narratives undergirding the contrarian bullish case for General Motors stock are intriguing, they’re also interpretive and highly speculative. Personally, I’d like to believe that connecting the dots in the narrative correlates to a higher likelihood of an earnings outperformance but that’s not something that can be readily quantified. It’s also uncertain how much of these fundamentals have already been baked into the share price.
To help narrow down some of the subjectivity in a forward-looking analysis, we can run a discretized inductive analysis. Induction is simply another term for pattern recognition, relying heavily on the uniformity of nature; that is, the assumption that the future often resembles the past.
All methodologies involving forecasting the unknown future — such as technical analysis — are inductive. For example, in certain technical disciplines, a head-and-shoulders pattern is a probabilistic omen that the target security is about to enter a downtrend.
However, a common difficulty in technical analysis is establishing a consensus of pattern validity, which can sometimes vary from analyst to analyst. That’s where the principle of discretization enters the frame. By force-converting a scalar signal (share price, which can theoretically rise infinitely) into a discrete signal with hard endpoints (such as the frequency of weekly candlesticks), we can condition our forward probabilities on objective and consistent classifications.
From there, we can run Markov simulations, which involve conditioning probabilities based on observed transitions from the current state to the future state. A good example is baseball. Managers don’t often care so much about seasonal batting averages but situational — such as when runners are in scoring position (RISP). By running this conditioned analytic, the skipper calculates the probability of the desired future state (scoring a run) based on the current state (an at-bat with RISP).
In my Markov simulation, I choose to define a behavioral state as a 10-week period of time. Through this specific signal, I look to calculate what the odds are for how the next 10-week period may materialize.
To be 100% clear, induction is not perfect. There is no universal law of the market that forces a signal to generate a specific outcome. One of the colloquial criticisms of induction is that just because you see a thousand white swans does not necessarily mean all swans are white. At the same time, induction is one of the best philosophical tools to better understand what may happen in the future.
A High-Risk, High-Reward Wager
Going back to GM stock, holding the security at random for a 10-week period generates an exceedance ratio of 58.8% (using a dataset going back to January 2019). Nominally, out of 362 rolling 10-week sequences, 213 of them popped higher than the starting price.
If you were to trade General Motors stock simultaneously across 100 parallel universes, you would statistically win out nearly 59 times. On average, the forward 10-week distribution would land between roughly $77 and $81 (assuming a starting price of $78.05), with probability density peaking at around $78.75.
However, the risk and the reward is that the forward distribution changes under the current signal. In the last 10 weeks, GM stock printed only three up weeks, leading to an overall downward slope. Under this setup, the exceedance ratio jumps to 69.2%, reflecting potential buy-the-dip sentiments. While that’s encouraging, the overall forward distribution on average is projected to land between $70 and $92.
Statistically, there appears to be a higher chance of GM stock being in the black relative to the starting position. But because the distribution expands both positively and negatively, there’s a risk of absorbing a more sizable loss if GM decides for whatever reason to wake up on the wrong side of the bed.
Still, based on the inductive data that we have, the bulls seem to have an edge. For those that don’t mind higher-risk ideas, the 82.50/85 bull call spread expiring June 18 — which at the time of writing features a nearly 166% maximum payout — could be enticing.
On the date of publication, Josh Enomoto did not have (either directly or indirectly) positions in any of the securities mentioned in this article. All information and data in this article is solely for informational purposes. For more information please view the Barchart Disclosure Policy here.
/Microsoft%20headquarters%20By%20Peter.jpeg)
/NVIDIA%20Corp%20logo%20outside%20building-by%20BING-JHEN_HONG%20via%20iStock.jpg)
/Micron%20Technology%20Inc_%20logo%20on%20building-by%20vzphotos%20vis%20iStock.jpg)
/Amazon%20-%20Image%20by%20bluestork%20via%20Shutterstock.jpg)
