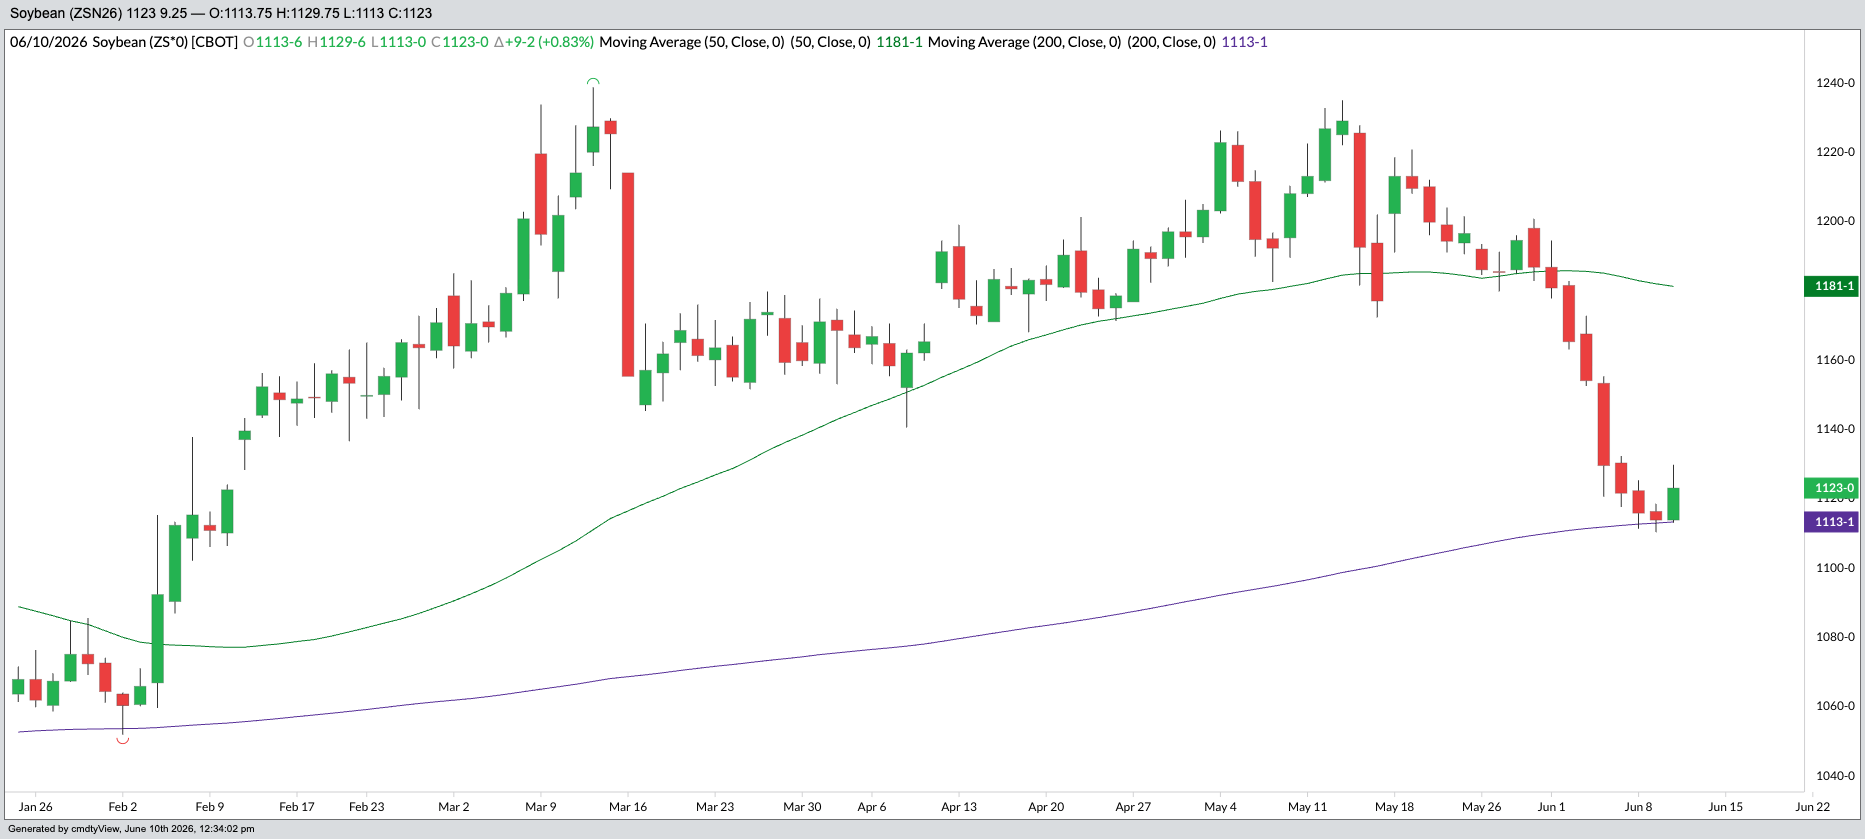
Soybeans are at a critical level on the Nearby Daily chart.
The purple line is the 200- Day Moving Average.
Notice how the far price was extended from the 200-day?
Notice how buyers are stepping in at that level.
Why is the 200-day significant?
Because there are eyes on it.
Not a few.
A lot.
We go into greater detail with multiple timeframes in yesterday's report.
I cover this technical setup and specific price targets in depth in the Klarenbach Grain Report.
Join 3,500+ farmers getting sell signals and technical roadmaps here:
Trent Klarenbach, BSA AgEc, PAg, publishes the Klarenbach Grain Report, Klarenbach Special Crops Report and The Spread Trader newsletters.
Klarenbach Research
Sign up below for a FREE trial of our newsletters


/2d%20illustration%20of%20Cloud%20computing%20by%20Blackboard%20via%20Shutterstock.jpg)