/Mckesson%20Corporation%20logo%20on%20building-by%20JHVEPhoto%20via%20iStock.jpg)
Irving, Texas-based McKesson Corporation (MCK) distributes pharmaceuticals, medical-surgical supplies, and health and beauty care products. With a market cap of $92.1 billion, the company also develops, implements, and supports software that facilitates the integration of data throughout the health enterprise. In addition, McKesson offers analytic, care management, and patient solutions for payers.
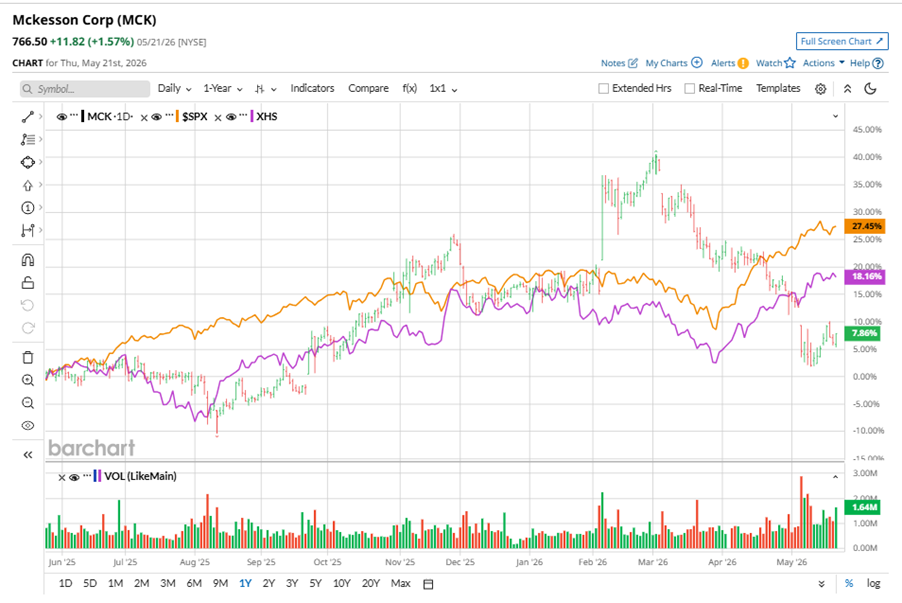
Shares of this healthcare giant have underperformed the broader market over the past year. MCK has gained 6.7% over this time frame, while the broader S&P 500 Index ($SPX) has rallied nearly 27.4%. In 2026, MCK stock is down 6.6%, compared to the SPX’s 8.8% rise on a YTD basis.
Narrowing the focus, MCK’s underperformance is also apparent compared to SPDR S&P Health Care Services ETF (XHS). The exchange-traded fund has gained about 15.8% over the past year. Moreover, the ETF’s 6% gains on a YTD basis outshine MCK’s losses over the same time frame.
On May 7, MCK shares closed up by 1.5% after reporting its Q4 results. Its adjusted EPS of $11.69 topped Wall Street expectations of $11.56. The company’s revenue was $96.3 billion, falling short of Wall Street forecasts of $101.9 billion. MCK expects full-year adjusted EPS in the range of $43.80 to $44.60.
For fiscal 2027, ending in March 2027, analysts expect MCK’s EPS to grow 13.2% to $44.29 on a diluted basis. The company’s earnings surprise history is impressive. It beat the consensus estimate in each of the last four quarters.
Among the 17 analysts covering MCK stock, the consensus is a “Strong Buy.” That’s based on 14 “Strong Buy” ratings, and three “Holds.”
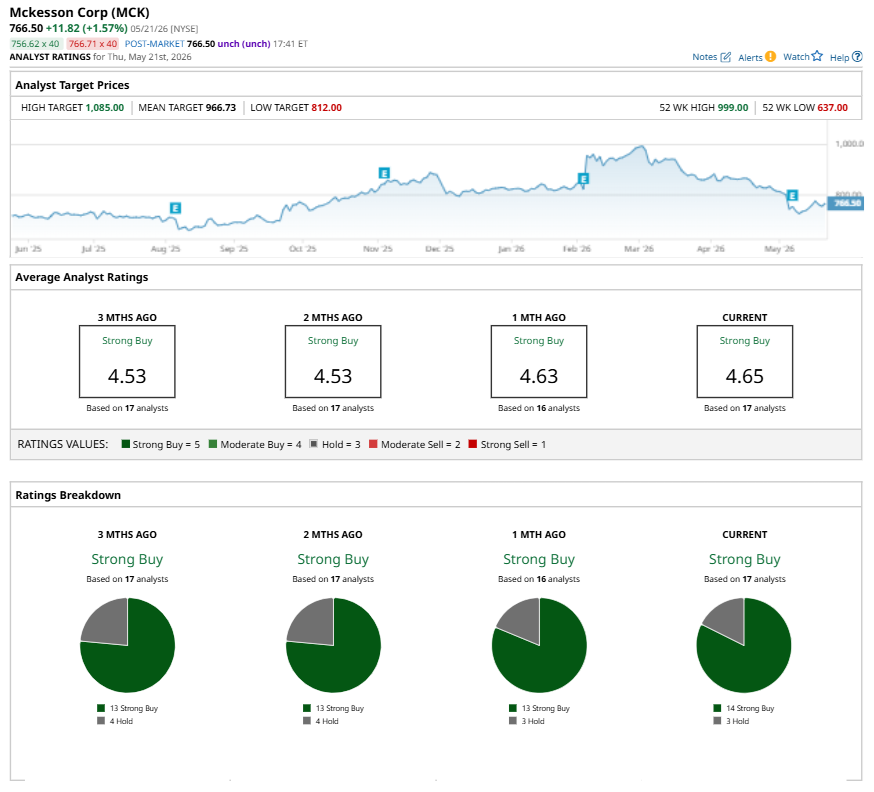
This configuration is more bullish than a month ago, with 13 analysts suggesting a “Strong Buy.”
On May 14, Citigroup Inc. (C) kept a “Buy” rating on MCK and lowered the price target to $945, implying a potential upside of 23.3% from current levels.
The mean price target of $966.73 represents a 26.1% premium to MCK’s current price levels. The Street-high price target of $1,085 suggests a notable upside potential of 41.6%.
On the date of publication, Neha Panjwani did not have (either directly or indirectly) positions in any of the securities mentioned in this article. All information and data in this article is solely for informational purposes. For more information please view the Barchart Disclosure Policy here.
/Intuit%20Inc%20logo-by%20Mojahid%20Mottakin%20via%20Shutterstock.jpg)


/Amazon%20pickup%20%26%20returns%20building%20by%20Bryan%20Angelo%20via%20Unsplash.jpg)