
The three wheat markets led the commodity complex to the upside Tuesday.
USDA took an axe to both US and global wheat numbers, creating a change in the flow of investment money from cattle to wheat.
In other news, soybean oil continued to follow diesel fuel higher, providing support to the rest of the oilseed sub-sector.
Since I posted Tuesday's Morning Commentary, my idea of a USDA WASDE report preview, it is only fair I post today's Afternoon Commentary as a WASDE review.
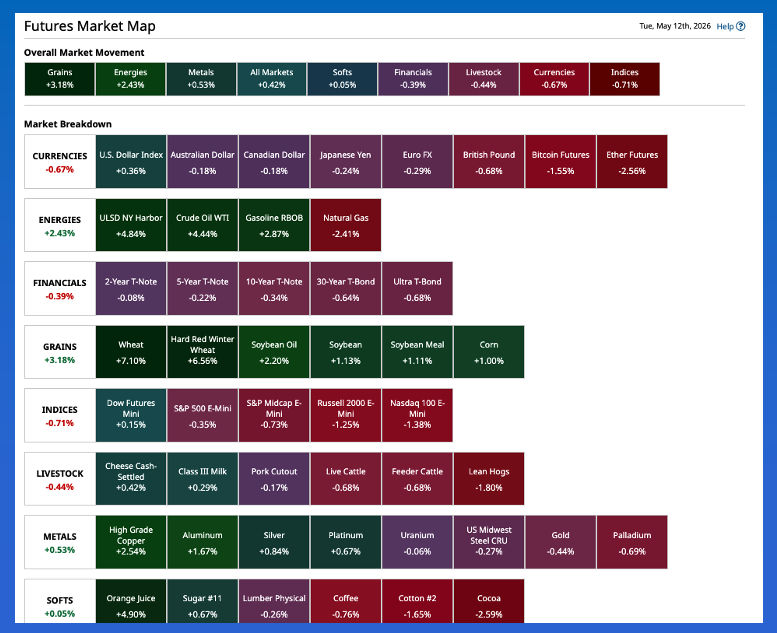
Afternoon Summary: I could start Tuesday’s Afternoon Commentary talking about how the higher April Consumer Price Index helped push US Treasury yields higher and weakened US stock indexes, all on the idea the FOMC’s next move will be a rate hike rather than a cut. Or I could talk about how the US president’s War on Iran helped rally the Energies sector again, putting aside any thought of a possible Turnaround Tuesday. I could talk about any number of things, but it all pales in comparison to what we saw in the Wheat sub-sector, where the Cockroach of the Grains Sector (aka Poverty Grass) had it’s moment to shine. A look at the Barchart Futures Market Heat Map Tuesday afternoon shows the three markets in the commodity complex posting the strongest gains are all wheat: SRW up 7.1%, HRW up 6.6%, and HRS with a gain of 5.3%. The leaders of the Energies sector were trailing at a distance with diesel fuel (distillates, heating oil, etc.) (HOM26) up 4.9% and WTI crude oil showing a gain of 4.4%. For the record, Brent crude was up 3.5%. Out in the Barn it was another day of what looked to be noncommercial selling, most likely a result of money flowing out of cattle and into wheat.
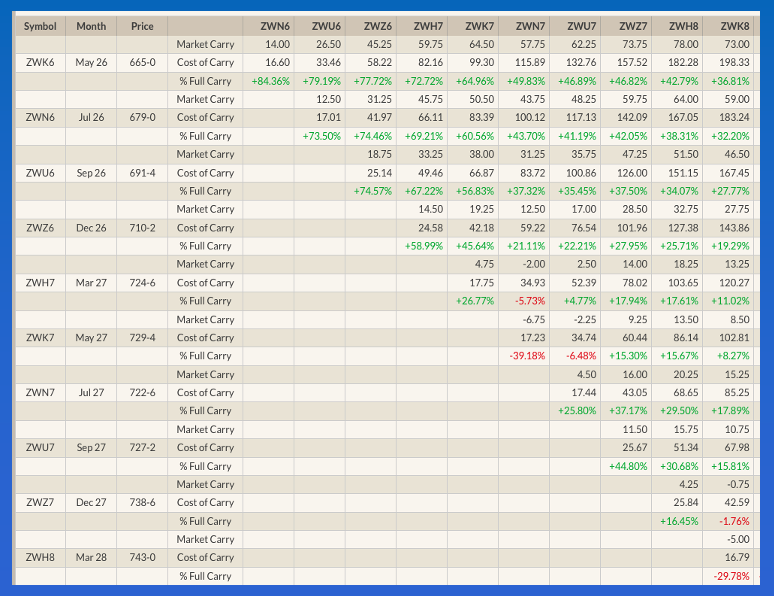
Wheat: Let’s start with the wheat sub-sector. I’ll get to HRW’s limit-up close in a moment but first let’s talk about SRW. Here we see the July issue (ZWN26) closed the limit-up 45.0 cents after USDA dropped US all wheat production 300 mb (8.13 mmt) from the 1.86 billion bushels guessed for the Annual Ag Forum this past February. This was a major reason global production, with this being the first 2026-2027 estimate, showed a year-to-year decrease of 24.8 mmt. It’s interesting to note the majority the world’s major producers all showed year-to-year declines of varying degrees. Thus, the rally in SRW wheat, the world’s largest wheat futures market. Recall the July-September futures spread has recently covered more than 90% calculated full commercial carry. At Tuesday’s close, this was trimmed to 73.5%. Do I believe it was all commercial buying? No. We also have to keep in mind Tuesday was the last day of the positioning week for Watson, and funds had switched to a net-short futures position as of a week ago today. The safe bet would be Watson now holds a net-long futures position once again. As for HRW, the July, September, and December contracts all closed up the daily limit 45.0 cents.
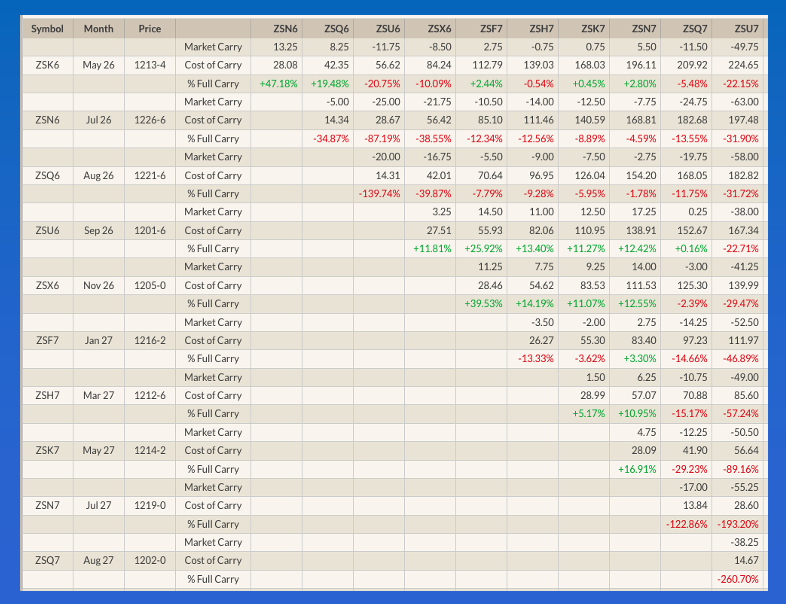
Soybeans: As we dive into the oilseed sub-sector, I’ll remind you diesel fuel was up 20.5 cents (5.2%) at this writing and just a few ticks off its session high. Given this, it was not overly surprising to see July soybean oil (ZLN26) rally as much 1.66 cents before closing 1.62 cents (2.2%) higher for the day. Additionally, the inverse (backwardation) in bean oil’s forward curve strengthened from July through the October issue. For its part, USDA played along by raising US domestic crush demand by 20 million bushels while increasing demand for soybean oil biofuel demand by 200 million pounds (1.4%) for 2025-2026 and 3.6 billion pounds more for 2026-2027. That’s going to create a lot of soybean meal, with the 2025-2026 ending stocks estimate increased by 13%. As for soybeans, the old-crop ending stocks estimate decreased by only 10 mb due to USDA lowering its export demand guess by 10 mb. Over in new-crop, production was decreased by 15 mb from the Ag Forum figure of 4.45 bb, with the next ending stocks guess down 45 mb at 310 mb. For the record, the November futures contract (ZSX26) closed 10.25 cents higher on what looked to be another round of noncommercial buying interest.
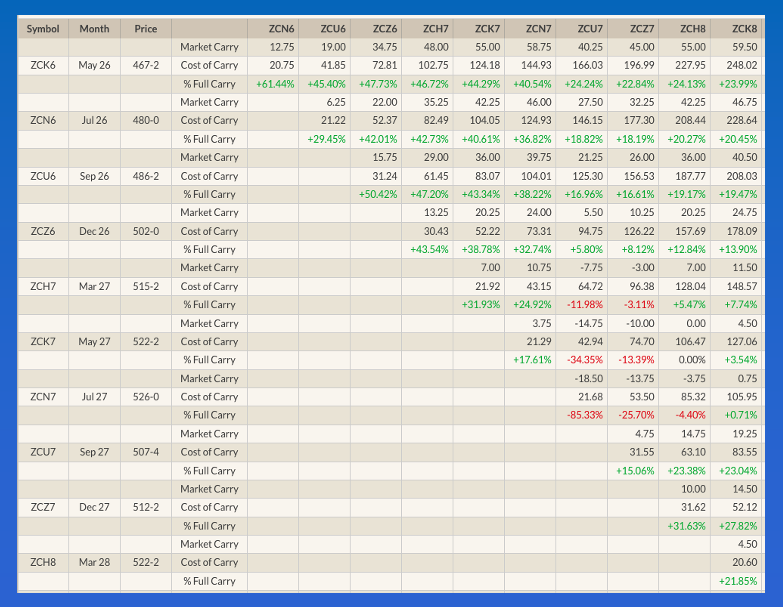
Corn: There wasn’t much to get excited about in the corn market, so Watson didn’t. Still, July (ZCN26) closed 4.75 cents higher, and on the round number $4.80, on trade volume of nearly 280,000 contracts. It will be interesting to see what the commercial side thought of the move when the National Corn Index and national average basis calculations come in tonight. As for Watson and USDA, old-crop ending stocks were increased by 15 mb due to a like decrease in the food/seed/and industrial demand category. Export demand was left at 3.3 billion bushels while the latest pace projection based on export shipments through the end of April was 3.423 bb. As for new-crop, 2026 production jumped to 15.995 bb from the 15.755 bb guessed at USDA’s Annual Ag Forum. That is a significant change, leading to the latest ending stocks guess increasing 120 mb to 1.957 bb. Still, all these numbers remain below estimates for the 2025-2026 marketing year with production at 17.02 bb and ending stocks of 2.142 bb. September corn closed 4.5 cents higher while December (ZCZ26) was up 4.25 cents and March settled 3.75 cents in the green. Futures spreads remain neutral-to-bullish as the attention could now turn to weather forecasts.
On the date of publication, Darin Newsom did not have (either directly or indirectly) positions in any of the securities mentioned in this article. All information and data in this article is solely for informational purposes. For more information please view the Barchart Disclosure Policy here.
/AI%20(artificial%20intelligence)/Ai%20chip%20by%20Quality%20Stock%20Arts%20via%20Shutterstock.jpg)

/A%20hand%20holding%20a%20phone%20with%20the%20Reddit%20logo_%20Mamun_Sheikh%20via%20Shutterstock_.jpg)
/Seagate%20sign%20on%20the%20building%20atits%20operational%20headquarters%20By%20JHVEPhoto.jpeg)
/Apple%20logo%20on%20store%20front%20by%20frantic00%20via%20iStock.jpg)