There is getting to be more chatter about US stock indexes looking to be in bubbles, similar to what was seen in 1999-2000.
The Grains sector has continued to see a flow of investment money into markets, even those with neutral at best fundamental outlooks.
Seasonally, key markets of the Grains sector have reached a bearish turning point.
There are a few key points to keep in mind as we get another week deeper into the Merry Month of May are 1) There is an old adage for US stock markets that says, “Sell in May and go away” and 2) The fund/investment side of the Grains sector, fueled in part by the ongoing rally in global stock indexes, have continued to add to their net-long futures positions nearly across the board and 3) The Poseidon Predicament tells us that when everyone is on the same side of the boat, the ship tends to roll over.
All this came to mind this past weekend as a pored over my weekly charts and studies, all while keeping an eye on my long-term investment positions in the Grains sector based on monthly charts. From a technical point of view there were a number of intermediate-term technical patterns that a long time ago in a galaxy far, far away would’ve been considered bearish, key reversals indicating trends had turned down. But that was back when those sorts of patterns mattered to traders, an idea that has gone the way of the dinosaur in this age of algorithm-driven trade. So, I made note of the patterns and moved on.
But the idea of intermediate-term changes in trend stuck with me as I got into the seasonal part of my analysis. A couple things to remember about seasonal analysis: 1) It is part of Market Rule #3, use filters (seasonality, price distribution, volatility) to manage risk and 2) Watson isn’t overly concerned about seasonal tendencies either. At least not to the degree seasonal analysts are. That being said, though, if markets in the Grains sector start to see increased commercial selling, normal this time of year as well, that begins to change the momentum indicators algorithms DO pay attention to, then it is possible markets could see the seasonal moves we’ve grown accustomed to. Additionally, if Michael Burry (of The Big Short fame) when he said, “the market (stock indexes) today feels like the last months of the 1999-2000 bubble”, then a top in equities could spark long-liquidation in other market sectors were investors hold large positions, including Grains. The more vulnerable markets would be those whose forward curves do not indicate bullish supply and demand situations.
Let’s take a look at seasonal studies for three key Grains markets. As usual, I’ll start with December Corn (ZCZ26).
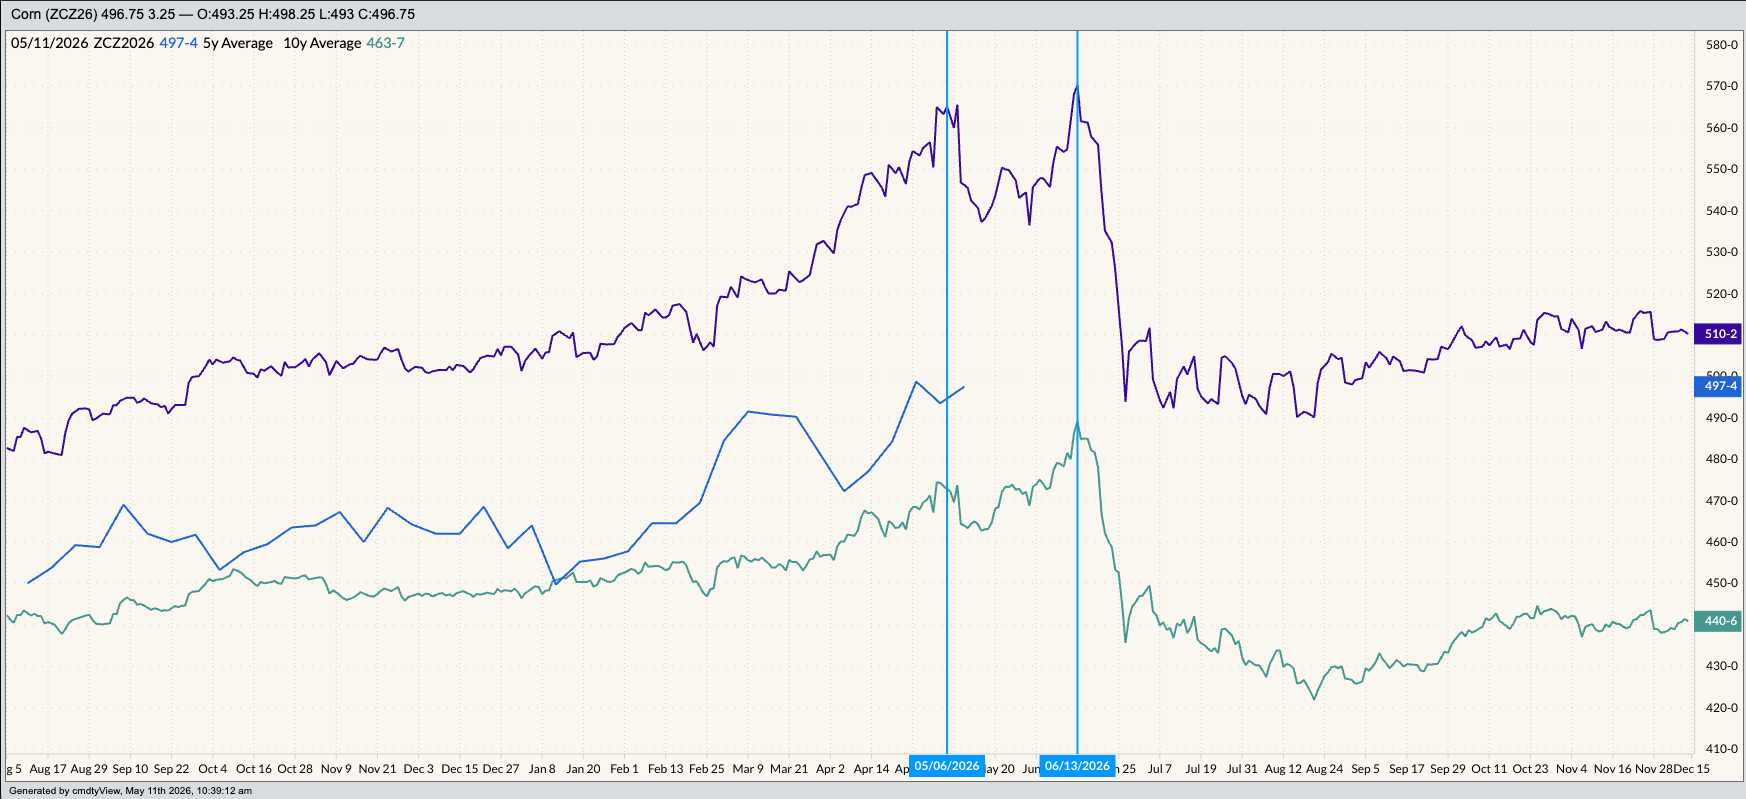
- Last Friday’s Commitments of Traders report (legacy, futures only) showed a noncommercial net-long futures position of 433,384 contracts as of Tuesday, May 5, an increase of 92,644 contracts from the previous week. This included an increase of 72,596 contracts of long futures and a decrease of 20,048 contracts of short futures. This was the largest net-long futures position since the week of February 25, 2025, at 441,161 contracts.
- National average basis remains weak while the 2026-2027 forward curve is neutral. Meaning funds do not have a fundamental reason to be adding to their long futures position.
- Seasonally, December corn futures tend to post a high weekly close between the second week of May (5-year average, last Friday) and the third week of June (10-year average). From there the contract tends to lose 11% percent through the first weekly close of September.
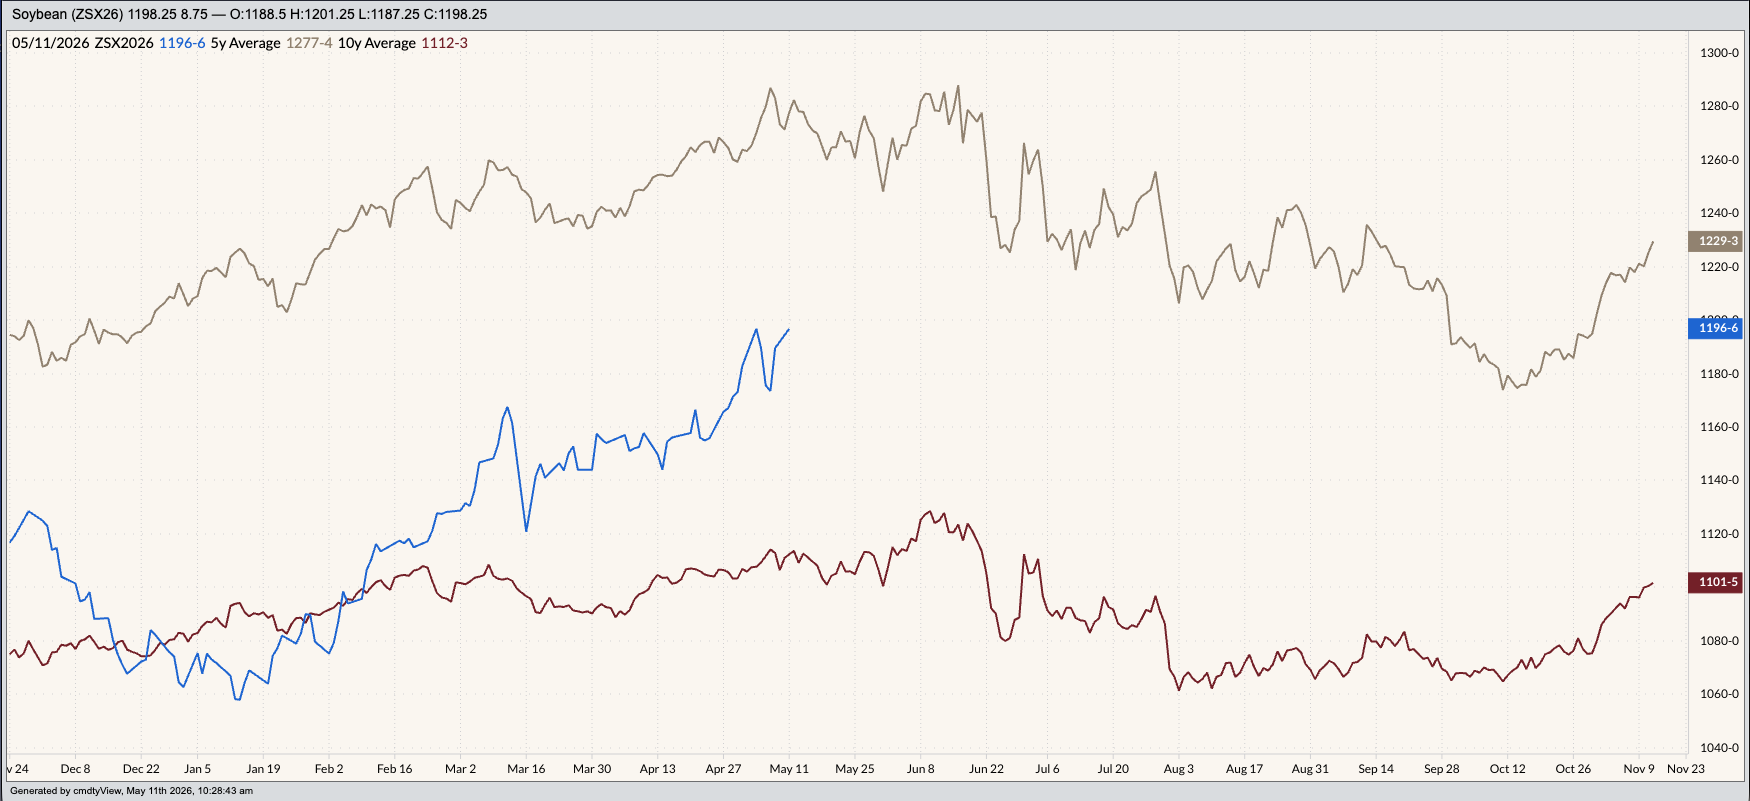
As for November Soybeans (ZSX26):
- The latest Commitments of Traders report showed funds held a net-long futures position of 232,198 contracts, an increase of 38,259 contracts from the previous week. This included an increase in long futures of 44,662 contracts and an increase in short futures of 6,403 contracts. This was the largest net-long futures position since 245,272 contracts the week of December 2, 2025.
- National average basis is neutral-to-weak while new-crop futures spreads are neutral-to-bullish, meaning funds have a bit more fundamental reason to add to their long futures positions.
- Seasonally, November soybean futures tend to post a high weekly close between the second week of May (5-year average) and second week of June (10-year average). From there the contract tends to fall between 5% and 7% through the end of October.
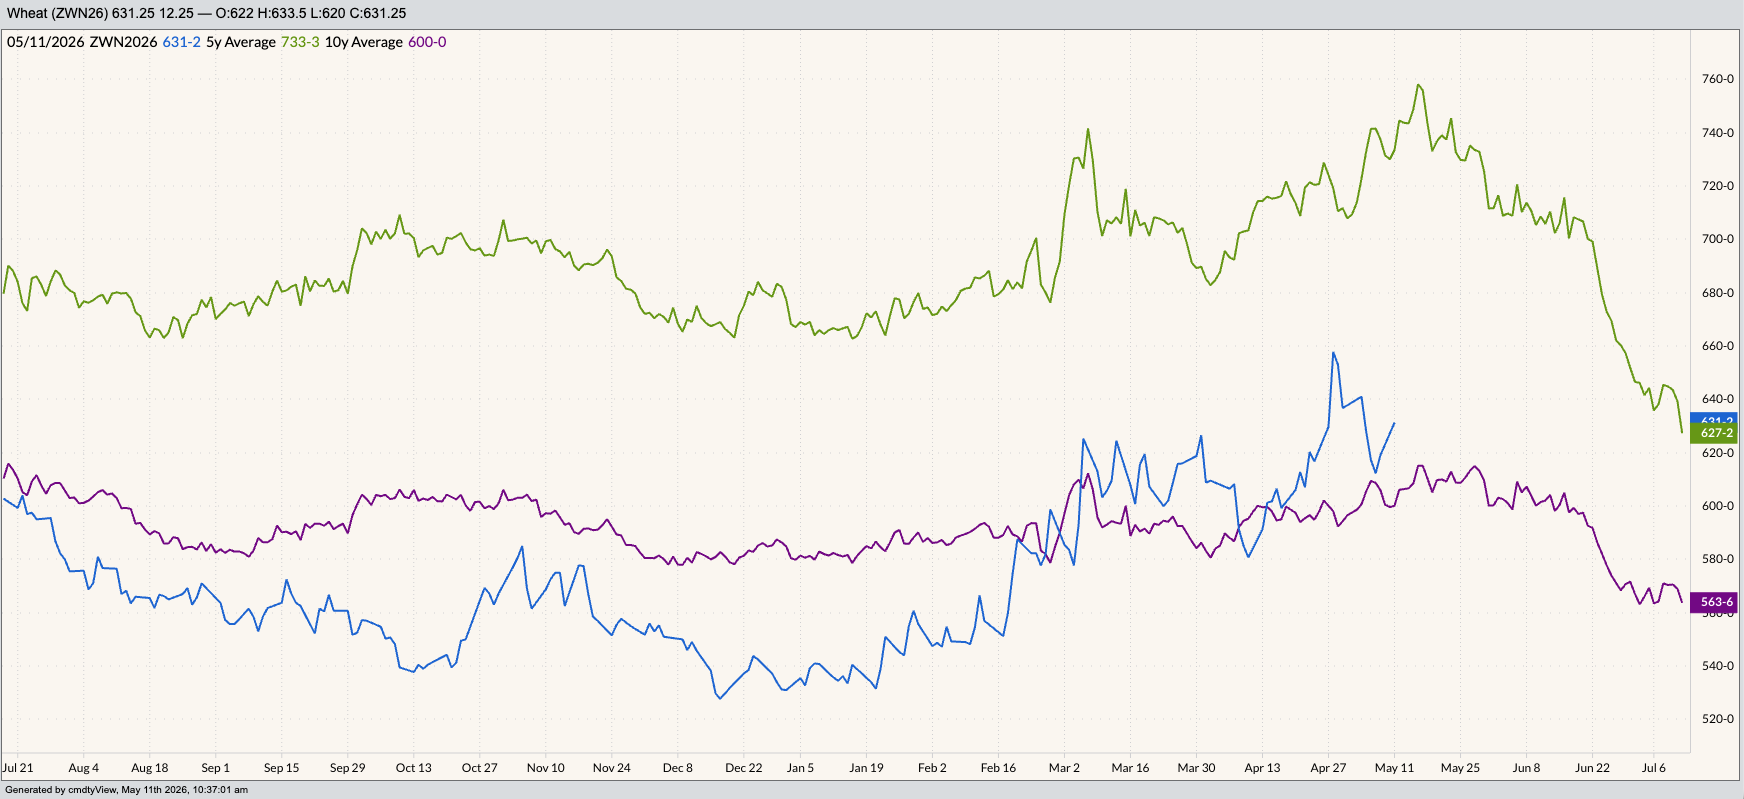
And then there’s July SRW (ZWN26), good ol’ Poverty Grass.
- Fundamentally, the market’s futures spreads (forward curve) covered an extremely bearish level of calculated full commercial carry at last Friday’s close: The July-September at 91% and the September-December at 86%. Yes, this is bearish, but we have to keep in mind SRW is using the CME’s lower variable storage rate of 5 cents per bushel per month. If we changed that to the 8 cents per bushel per month used in HRW those same two spreads would’ve settled last week covering roughly 64% and 62%, still leaning bearish.
- Because of this, the latest Commitments of Traders update showed Watson held a net-short futures position of 16,668 contracts, a switch of 17,534 contracts from the previous week. SRW could be a template for other markets, if we see increased commercial selling emerge.
- Seasonally, the July SRW issue tends to post a high weekly close the second week of May (again, last Friday) before losing between 13% (5-year average) and 6% (10-year average) through the end of June.
On the date of publication, Darin Newsom did not have (either directly or indirectly) positions in any of the securities mentioned in this article. All information and data in this article is solely for informational purposes. For more information please view the Barchart Disclosure Policy here.
/Microsoft%20Corporation%20logo%20on%20sign-by%20Jean-Luc%20Ichard%20via%20iStock.jpg)
/Dell%20Technologies%20by%20Poetra_RH%20via%20Shutterstock.jpg)