
The sugar and corn market has taken on a new dimension since ethanol's inception, generally considered food products and feeding many countries worldwide. With the world population growing by 67 million people per year, the supply of these two commodities was already struggling in some years.
Ethanol has now joined the consumer role of corn and sugar. Approximately 60 percent of world ethanol production uses sugar crops as the primary source, with the remaining 40 percent using grain crops as the primary source.
Specifications and statistics
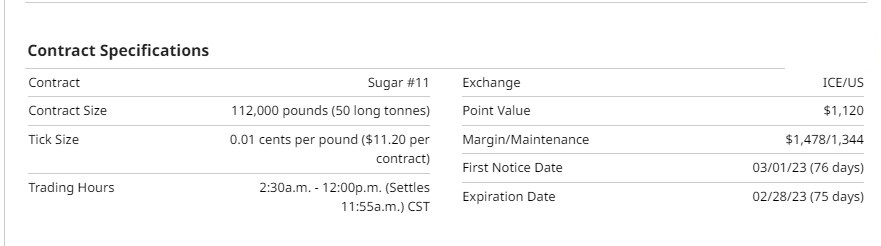
The most liquid sugar futures contract is traded on the Intercontinental Exchange (ICE). The trading symbol for the standard-size contract is SB. Options on the futures contract are available as well. Before trading options, futures, or equities, seeking training first is recommended.
For equity traders, the Teucrium Sugar Fund provides investors with unleveraged direct exposure to sugar without the need for a futures account, symbol CANE. CANE was designed to reduce the effects of rolling contracts (contango and backwardation impacts on roll cost ) by not investing in front-month (spot) futures contracts, thus limiting the fund's number of contract rolls each year.
Sugarcane is cultivated in tropical and subtropical regions around the world, roughly between the Tropics of Cancer and Capricorn. The largest cane producers are in Brazil, while the States of Florida, Louisiana, Texas, and Hawaii are the domestic leaders. It grows best in hot, wet climates with heavy rainfall followed by a dry season. On a commercial basis, sugarcane is not produced from seeds but from cuttings or pieces of the stalk.
Sugar beets, produced in temperate or colder climates, are annuals grown from seeds. The beets are planted in the spring and harvested in the fall. Sugar beets do best with moderate temperatures and evenly distributed rainfall. Sugar beet production occurs mainly in Europe, the US, China, and Japan.
Brazil, India, Thailand, China, and the United States are the largest sugar-producing countries.
Recent Performance
Over the previous three months, sugar has had a 15% return. Year-to-date returns were 10%. The three-month performance reflects the recent rally the sugar market has experienced as ethanol refiners ramp up for the upcoming driving season.
Technicals
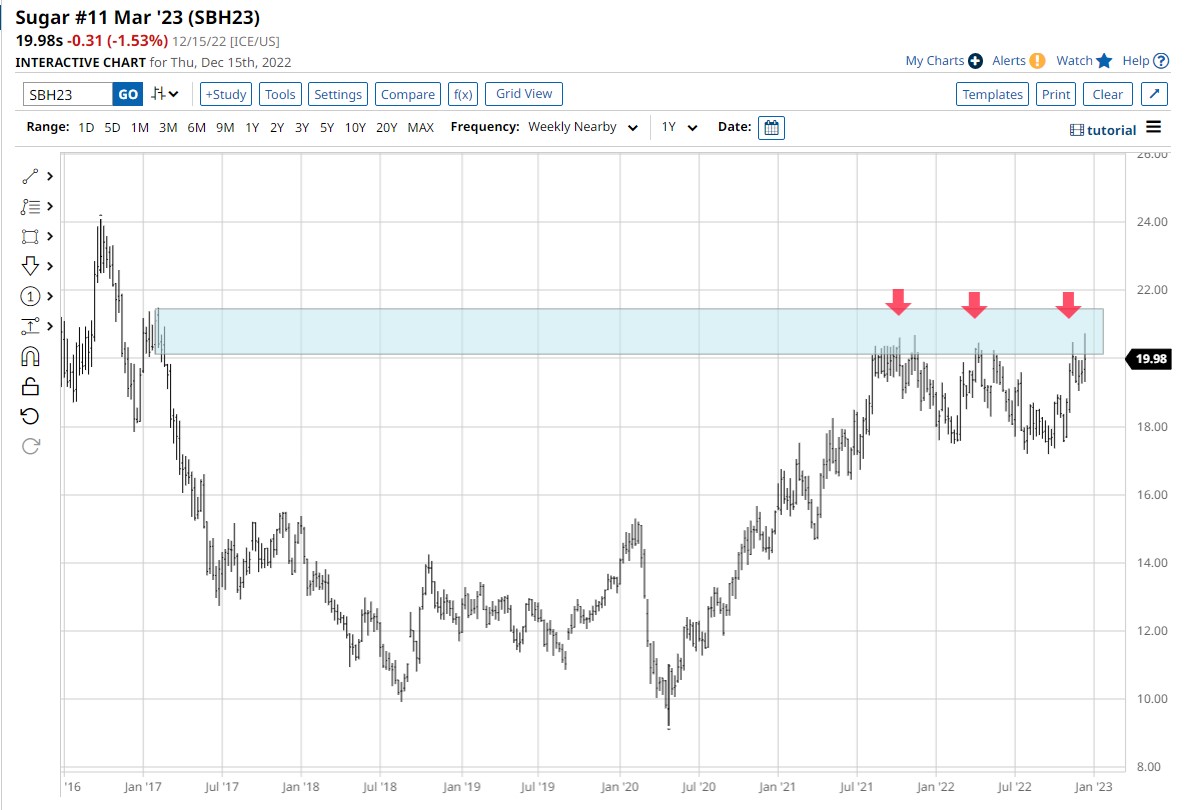
The weekly nearby continuous chart illustrates that the current price is trading at significant resistance from January 2017. Sugar began the current uptrend near June 2020, and since trading near weekly, resistance has evolved into a channel pattern.
Double-top patterns are popular reversal patterns in technical analysis. I've highlighted three double-top patterns formed each time sugar tried to trade through this resistance. However, it is rare to see three in a row so close to each other. While the sellers seem to control this current area, for now, the longer the price trades here, the more the supply is being reduced.
Will the bullish seasonal pattern push prices through resistance this time?
Seasonality
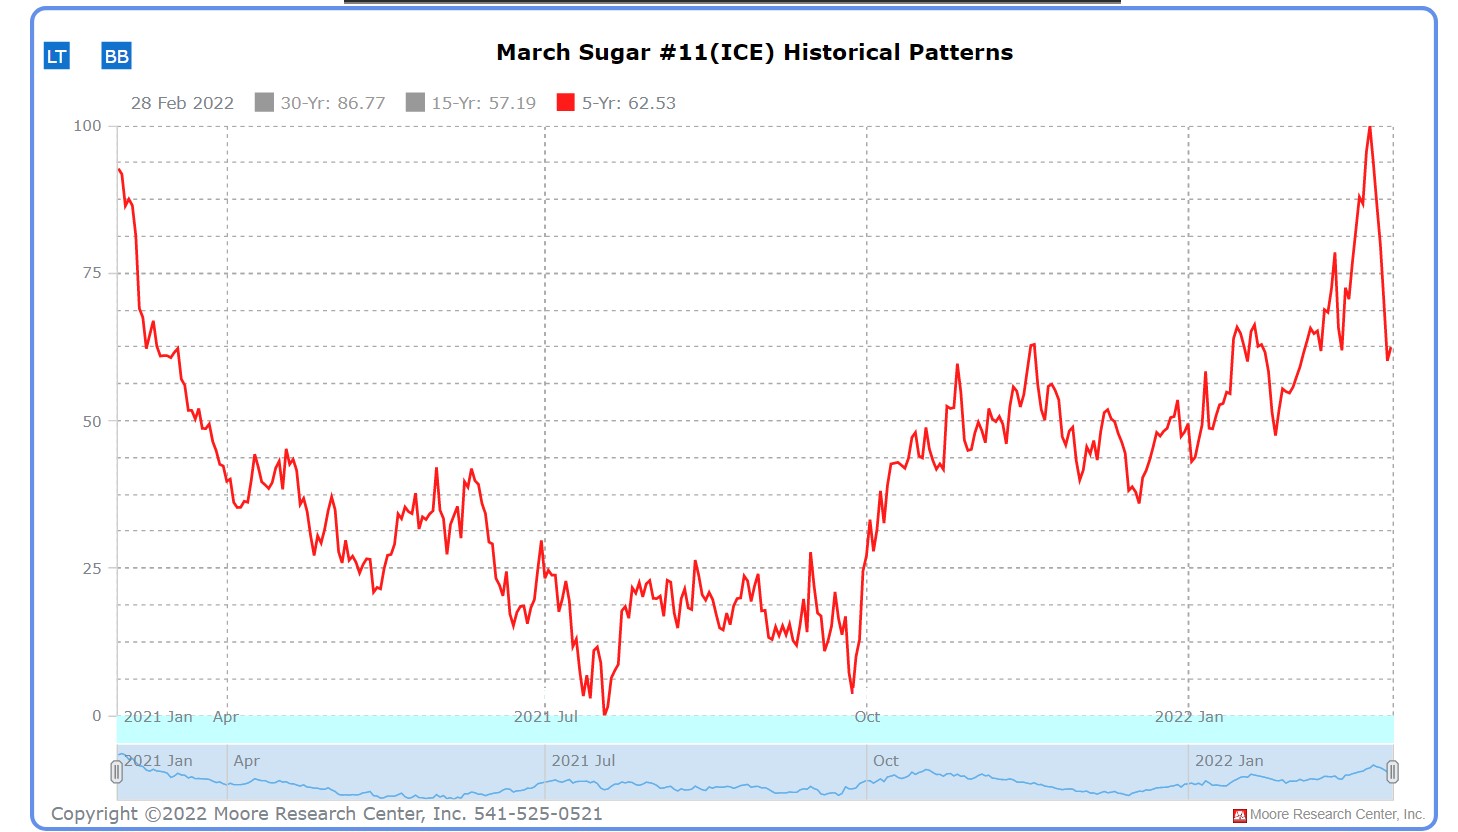
Source: Moore Research Center, Inc. (MRCI)
The daily sugar chart below illustrates the seasonal low made in August and then retested in late September, much like its seasonal pattern (chart above) has done in the last five years. Prices then rallied into November and corrected from that peak. Reaching its low in early December and then another strong rally from there.
MRCI research covers the past 5, 15, and 30 years. My experience using their data has found that when all three periods are in sync with the same seasonal pattern, the seasonal signal is stronger that season.
There is a reason their research covers multiple periods. Fundamental events influence markets and, over time, create consistent, repetitive patterns. Numerous research periods will align if the fundamentals stay intact for a long time. However, when fundamentals change for a market, the five-year pattern deviates from the 15 and 30 years.
I've noticed this change in the sugar market and found that the five-year pattern best represents the seasonal patterns. Seeing this change only requires looking at the recent price action compared to all three periods that MRCI has researched.
Ethanol production is changing the seasonal sugar pattern. Will this also change the corn seasonal pattern? It might, but for now, I've found corn prices still track the 15-year seasonal well.
The Commitment of Traders (COT) Report
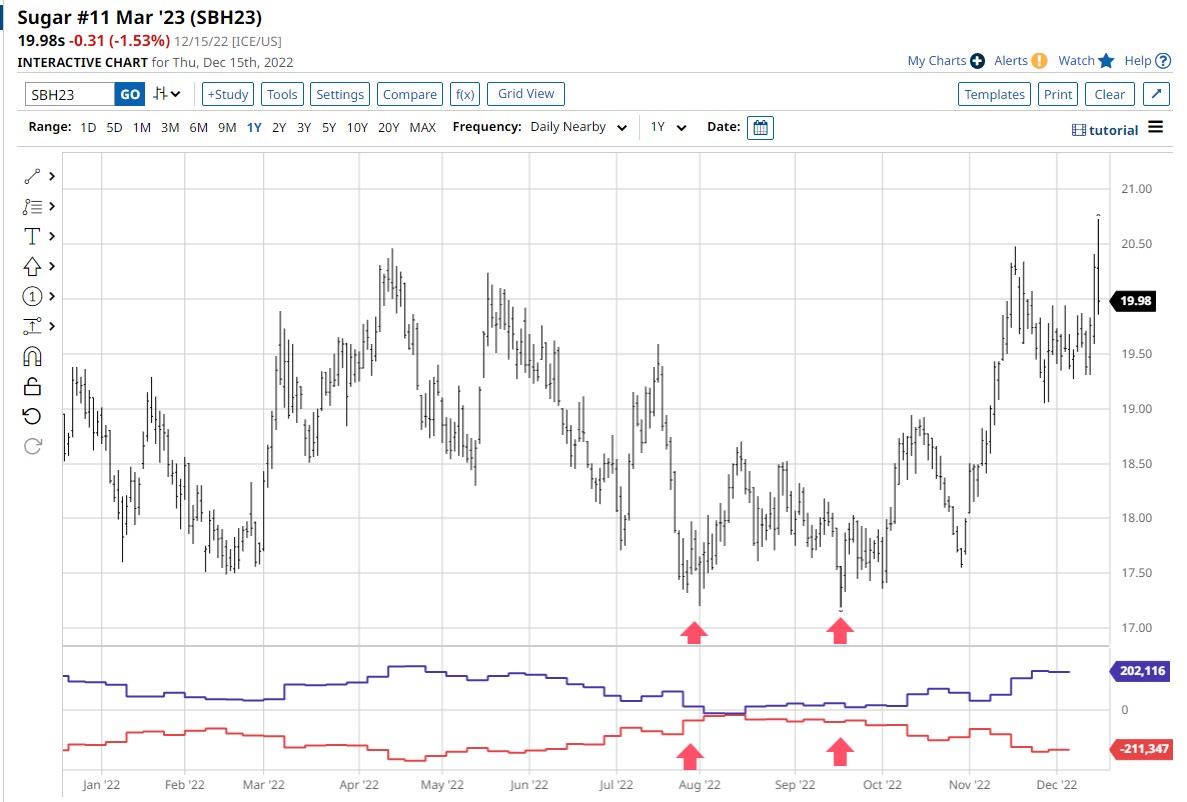
The COT report illustrated that when the seasonal low in sugar formed in August, the commercial traders (red line) were more bullish than at any time in the past 12 months. During the next month of trading, the commercials maintained their bullish posture retesting the August lows in September. As the commercials were scaling into their long positions, managed money (blue line) was flat to bearish in their positions. As the uptrend began to form, managed money (typically trend followers) began building long positions (the blue line was stepping up each week).
Just like the COT can help identify new trends, it can also let traders know when a trend is crowded (excessive longs or shorts in the trend.) The recent COT report reflects that managed money is more bullish than in the past year. An essential point to using the COT is to confirm the signal with your charts. When we reviewed the technical analysis of sugar, we saw that the market trades at significant resistance on the weekly chart. These two facts make sugar susceptible to price correction.
Summary
Professional traders know that prices don't move in a straight line up or down. While sugar is displaying bullish tendencies now, market internals indicates patience is prudent.
Sugar's uptrend from its seasonal low usually goes into February, allowing traders to wait for a price correction before participating in the next rally.
During this period, many markets become less liquid due to large traders closing their books for the year. The markets become dominated by short-time frame traders randomly chasing price action, causing stop losses to be filled.
More Stock Market News from Barchart
- Competition Weighs on Chinese Electric Vehicle Makers
- Stocks Fall as Central Banks Remain Hawkish
- Here’s Why Investors May Want to Take the Contrarian Angle for Vista Outdoor (VSTO)
- Verizon Communications Put Options Premiums Are Attracting Short Income Players
On the date of publication, Don Dawson did not have (either directly or indirectly) positions in any of the securities mentioned in this article. All information and data in this article is solely for informational purposes.


/Nvidia%20logo%20by%20Konstantin%20Savusia%20via%20Shutterstock.jpg)
/Apple%20products%20on%20desk%20by%20Ake%20Ngiamsanguan%20via%20iStock.jpg)
/Eli%20Lilly%20%26%20Co_%20by%20Tada%20Images%20via%20Shutterstock.jpg)