
With each passing week, a structural shift in the stock market becomes more likely. The exotic, high-beta products that defined the previous year’s rally are being unceremoniously liquidated. In their place, a “bunker mentality” has taken hold, forcing a return to the industrial bedrock of the global economy.
There are good reasons for this, and I’ll explore those below. However, I think there’s still plenty of room for skepticism about any part of the stock market, as we see how the twin challenges of tariff impact and oil prices play out. But as I’ve said here recently, I’m always on the look out for pockets of opportunity, even in the strangest of stock market conditions. Which is what we have right now.
Energy Stocks: Making Up for Lost Time?
For much of the AI-led cycle, the energy sector was treated as a relic, whittled down to a mere 3% or 4% of the S&P 500 Index ($SPX). Investors are now waking up to the reality that they are dangerously underweight in the only commodity that currently dictates global risk. We are seeing a massive reconsideration of this sector, which was once the largest of the 11 major ones tracked by S&P. Capital has been flowing back into the XLE ETF (XLE), the biggest energy stock tracker.
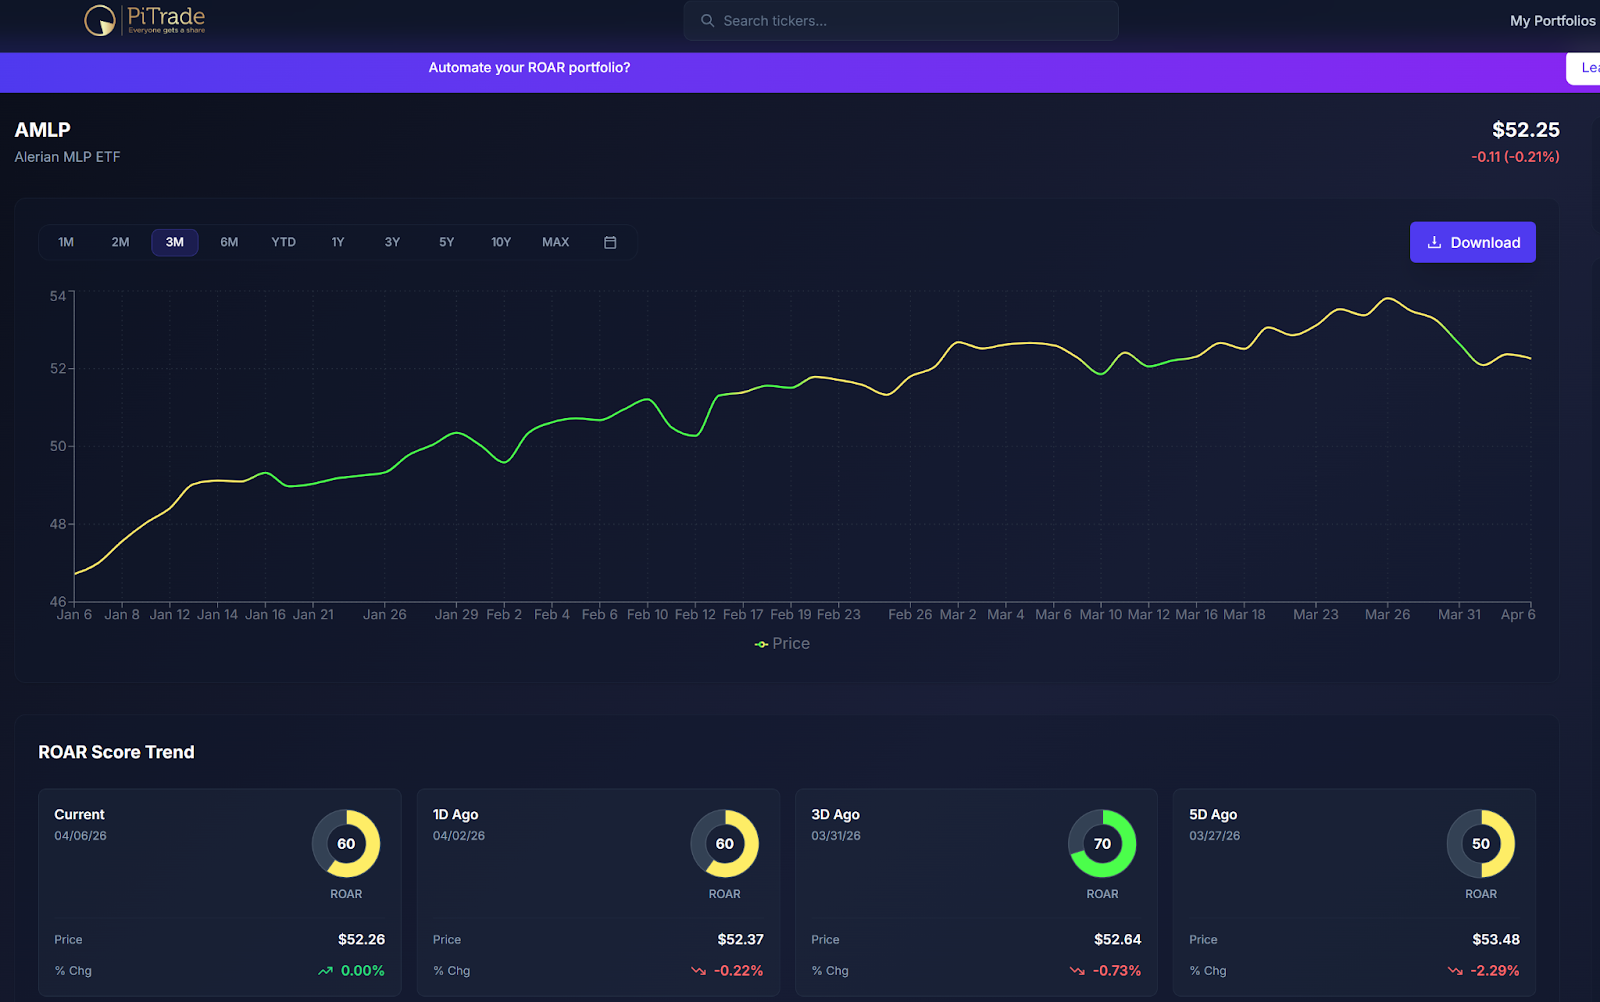
The other area traders are looking toward is energy infrastructure. The Alerian MLP ETF (AMLP) has emerged as a solid alternative for those seeking stable, “toll-booth” style cash flows. MLPs neither drill for sources of energy, nor do they refine it. They transport it.
Because Master Limited Partnerships are generally excluded from the S&P 500, they offer a diversification benefit that traditional index funds cannot provide. In a world of elevated oil prices, companies that move and store the molecules are proving to be far more resilient than those just trying to find them.
Still, AMLP and ETFs like it are not a panacea. When the market gets in a foul mood about all things equity-related or tied to the energy sector, this ETF is not spared. Beware of a market climate that turns quickly into “throwing babies out with the bathwater.”
The Best Defense Is… A Good Defense Industry ETF?
The narrative for defense industry stocks has also evolved. While traditional aerospace funds like the iShares US Aerospace & Defense ETF (ITA) and Invesco Aerospace & Defense ETF (PPA) remain steady anchors, the current market demands a more technologically advanced shield. That points to digital and unmanned systems that define modern conflict.
This is why specialized ETFs like the Global X Defense Technology ETF (SHLD) and the Rex Drones ETF (DRNZ) are outperforming the broader benchmarks.
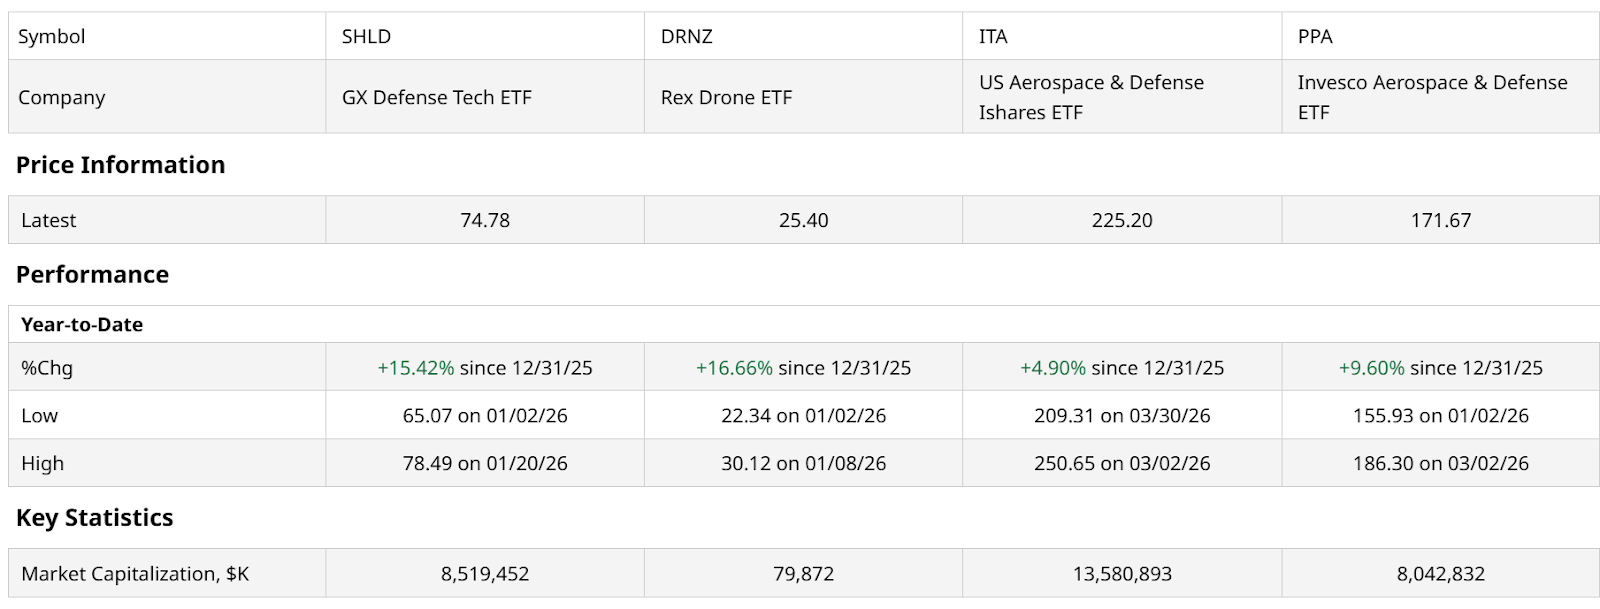
Investors are realizing that defense is now as much about cybersecurity and electronic warfare as it is about tanks and planes. These ETFs capture the high-margin, tech-heavy side of the industry that is currently at the center of the global stage.
Let’s finish by looking at these two market areas in the charts. First, while I am in sync with the fundamental aspect and transition toward the type of stocks owned by SHLD, this chart does not look ready for liftoff to me. It is very rangebound, which is to be expected after doubling from January 2025 through the same month in 2026.
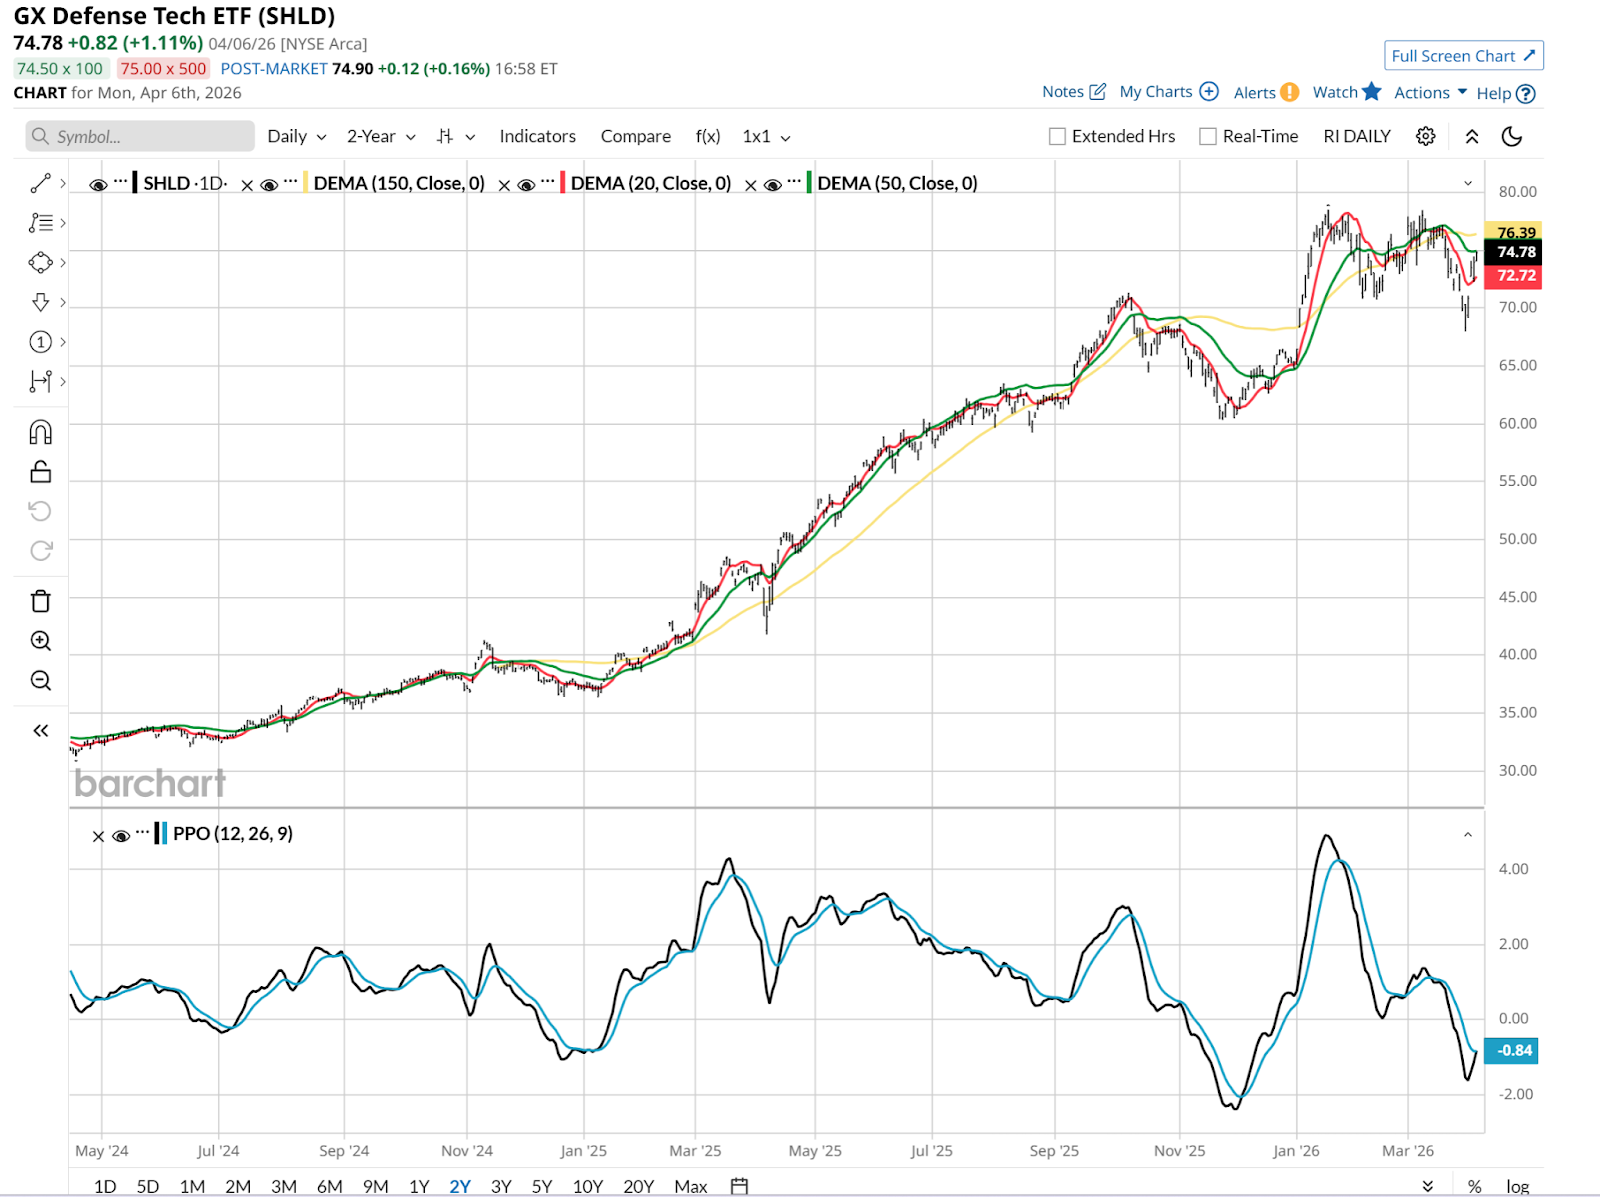
Trees don’t grow in the sky. And even if rockets do, this is not a market that easily puts any ETF’s price into orbit for long.
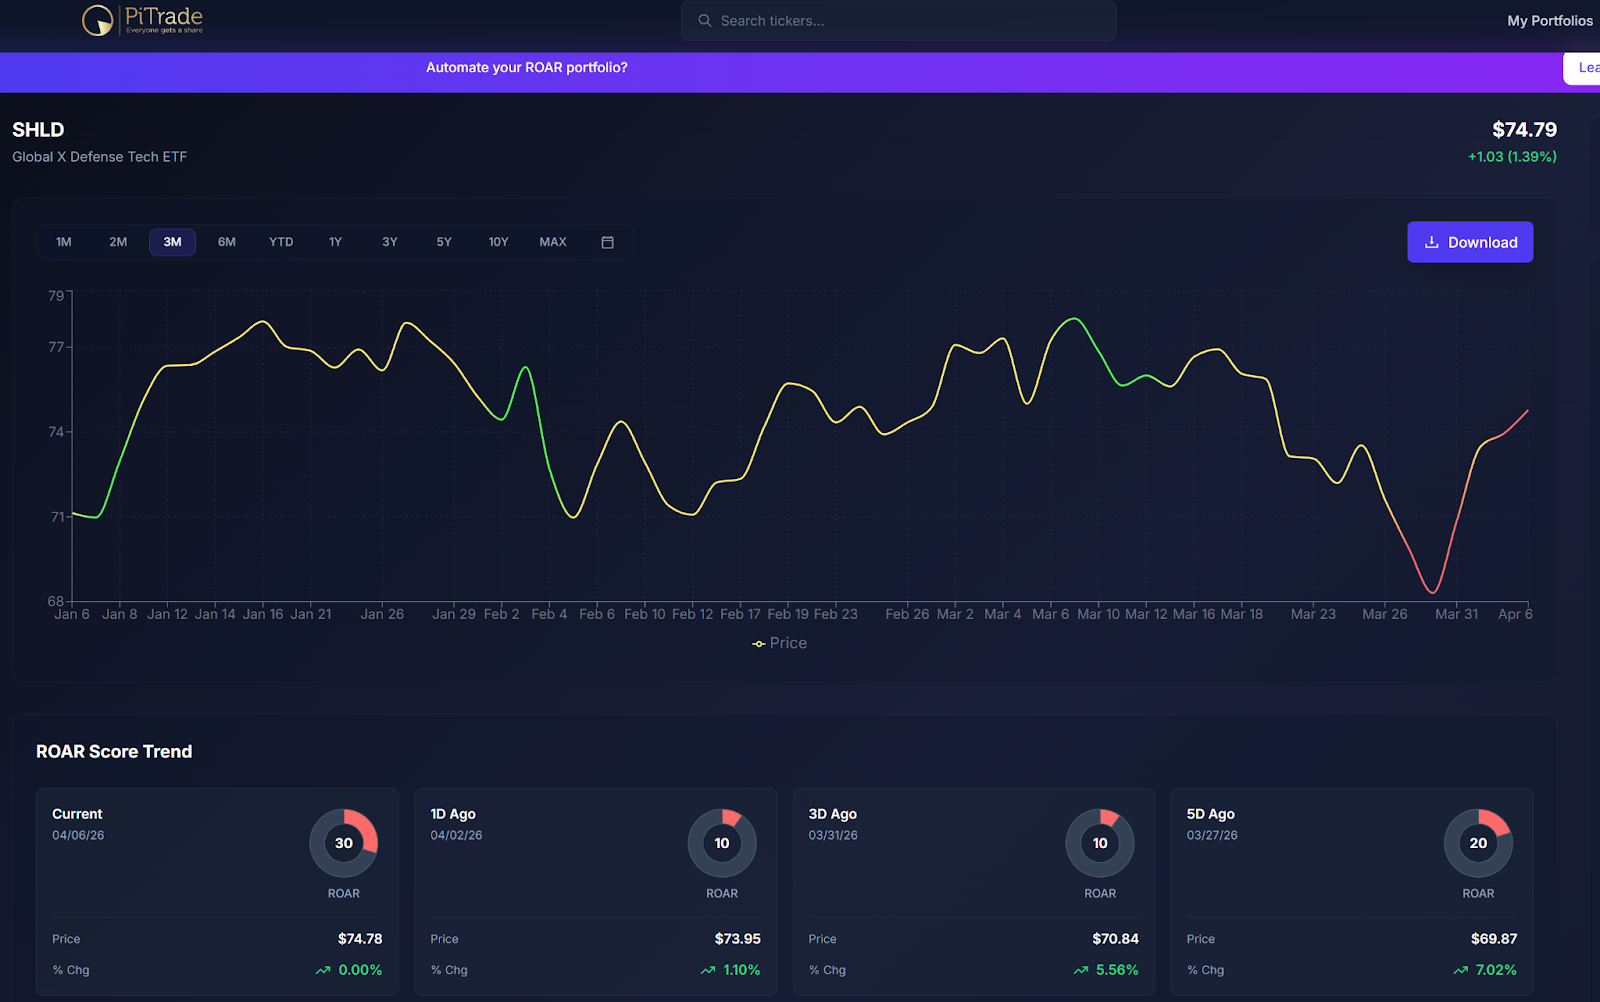
The recent mini-spike (7% in a week’s time, following a 10% dip) is reflected in a ROAR Score that saw a slight lift on Monday. It stands at 30, up from the 10-20 range, and that’s a step away from neutral risk status. It is still in the red zone (higher risk). But this industry’s direct ties to what happens in the Iran War, particularly the Strait of Hormuz, is liable to be more erratic than any technical analysis system can keep up with for now.
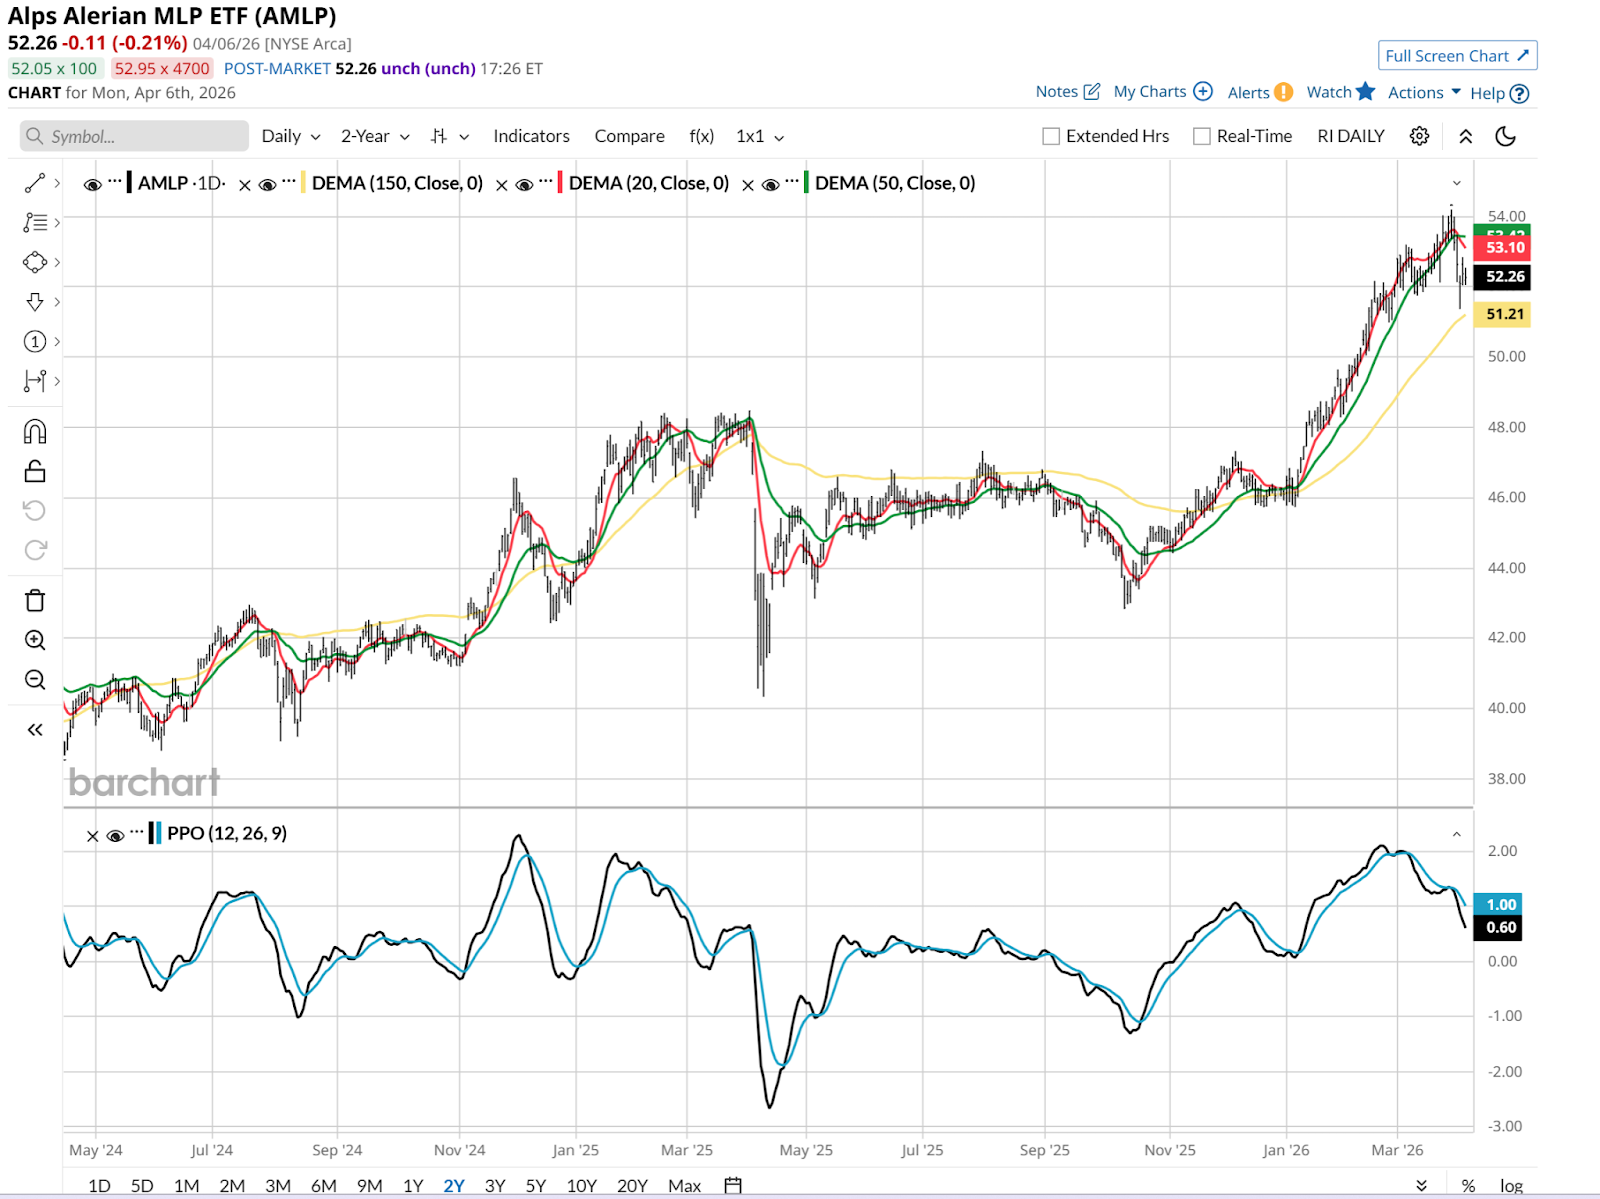
AMLP’s chart is another that says to me, “your narrative says yes, but your technicals say no.” That daily chart below is threatening to break down. Just look at the PPO. Not broken yet, and still above the important zero line. However, it is a high-risk situation currently.
That lofty perch upon which AMLP sits goes a long way toward explaining why AMLP’s ROAR Score looks like this (below). It turned green (lower risk) on Jan. 16 of this year, and a 10% rally followed. That box checked, it has meandered since, and appears to have lost steam. All it would take is any type of headline that translates to “oil is not going to $150 a barrel” and AMLP could fade quickly, along with its energy sector peer ETFs.
Narrative is one thing, actual price movement is another. Only the latter is yours to keep. So in this time of confusing market signals, don’t just buy into what sounds good. Identify a reliable decision-making discipline you can stick with, and use it consistently.
Rob Isbitts created the ROAR Score, based on his 40+ years of technical analysis experience. ROAR helps DIY investors manage risk and create their own portfolios. For Rob's written research, check out ETFYourself.com.
On the date of publication, Rob Isbitts did not have (either directly or indirectly) positions in any of the securities mentioned in this article. All information and data in this article is solely for informational purposes. For more information please view the Barchart Disclosure Policy here.


/Alphabet%20(Google)%20Image%20by%20Markus%20Mainka%20via%20Shutterstock.jpg)