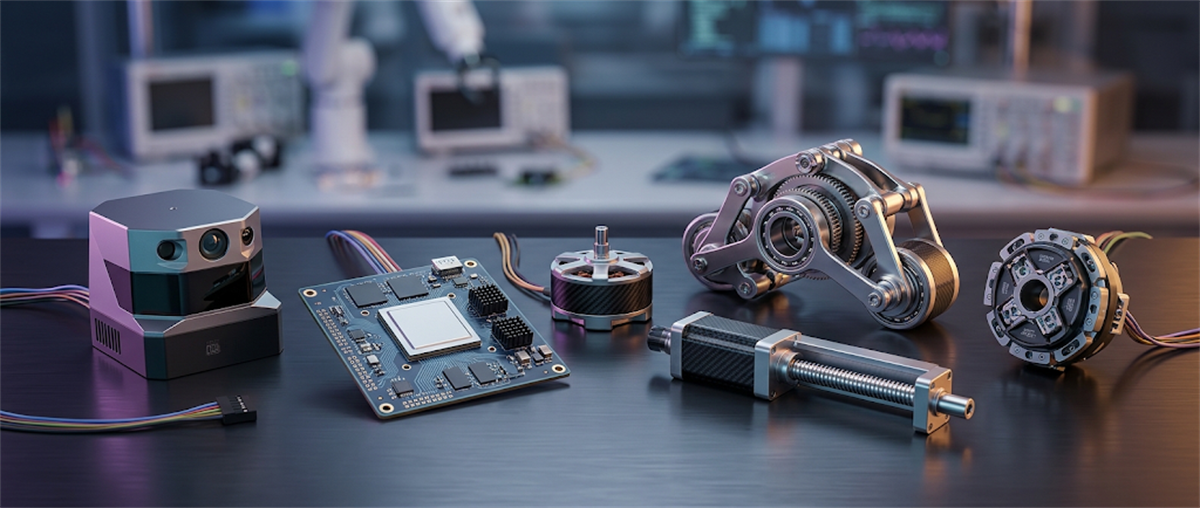
Your browser of choice has not been tested for use with Barchart.com. If you have issues, please download one of the browsers listed here.
Jump-Start Your Search For Promising Trade Ideas With Barchart Premier’s "Top Stock Pick". FREE 30 Day Trial
Stocks | Futures | Watchlist | News | More
or
Faster, Cleaner, Better.

Ametek Inc (AME)

Ametek Inc (AME)
[[ item.lastPrice ]] [[ item.priceChange ]] ([[ item.percentChange ]]) [[ item.tradeTime ]] [NYSE]
[[ item.bidPrice ]] x [[ item.bidSize ]] [[ item.askPrice ]] x [[ item.askSize ]]
[[ session ]] by (Cboe BZX)
[[ item.lastPrice ]] [[ item.priceChange ]] ([[ item.percentChange ]]) [[ item.tradeTime ]] [NYSE]
[[ item.bidPrice ]] x [[ item.bidSize ]] [[ item.askPrice ]] x [[ item.askSize ]]
[[ session ]] [[ item.lastPriceExt ]] [[ item.priceChangeExt ]] ([[ item.percentChangeExt ]]) [[ item.tradeTimeExt ]]
News & Headlines for [[ item.sessionDateDisplayLong ]]
AMETEK Announces First Quarter 2026 Earnings Call and Webcasted Investor Conference Call Information

- Earnings to be released before market opens on Thursday, April 30, 2026 -

AME : 236.26 (+2.61%)
1 Profitable Stock with Competitive Advantages and 2 Facing Headwinds

1 Profitable Stock with Competitive Advantages and 2 Facing Headwinds

TROW : 96.98 (+1.28%)
AME : 236.26 (+2.61%)
CDRE : 31.32 (+2.92%)
1 S&P 500 Stock with Exciting Potential and 2 We Brush Off

1 S&P 500 Stock with Exciting Potential and 2 We Brush Off

SHW : 345.55 (+3.66%)
AME : 236.26 (+2.61%)
MTD : 1,340.58 (+3.85%)
Rockwell Automation Stock: Is ROK Outperforming the Industrial Sector?

Rockwell Automation has outpaced the broader industrial sector over the past year, and analysts are fairly bullish on its future outlook.

XLI : 173.51 (+1.87%)
AME : 236.26 (+2.61%)
ROK : 415.73 (+3.21%)
Ingersoll Rand Stock: Is IR Underperforming the Industrial Sector?

Ingersoll Rand has underperformed the broader industrial sector over the past year. However, Wall Street analysts remain moderately optimistic about its prospects.

XLI : 173.51 (+1.87%)
IR : 85.80 (+2.55%)
AME : 236.26 (+2.61%)
AMETEK Stock: Is AME Underperforming the Industrial Sector?

AMETEK has underperformed the Industrial sector over the past year, but analysts are cautiously optimistic about the stock’s prospects.

XLI : 173.51 (+1.87%)
AME : 236.26 (+2.61%)
ETN : 406.21 (+3.43%)
Gabelli Hosts 36th Annual Pump, Valve, and Water Systems Symposium

GREENWICH, Conn., Feb. 18, 2026 (GLOBE NEWSWIRE) -- Gabelli Funds, LLC, will host its 36 th Annual Pump, Valve, & Water Systems Symposium at Convene 530 Fifth Avenue in New York, NY on Thursday, February...

GGG : 86.74 (+2.14%)
ITT : 219.02 (+3.09%)
NPO : 281.67 (+3.65%)
CR : 192.81 (+3.61%)
MWA : 29.07 (+2.00%)
GAMI : 23.6000 (+0.51%)
WTS : 302.45 (+0.90%)
OIS : 10.22 (-5.98%)
FELE : 101.68 (+2.58%)
AME : 236.26 (+2.61%)
GRC : 68.26 (+0.89%)
BMI : 115.54 (-24.13%)
3 Big Reasons AME Should Be On Your Watchlist

3 Big Reasons AME Should Be On Your Watchlist

AME : 236.26 (+2.61%)
Unpacking Q4 Earnings: AMETEK (NYSE:AME) In The Context Of Other Internet of Things Stocks

Unpacking Q4 Earnings: AMETEK (NYSE:AME) In The Context Of Other Internet of Things Stocks

AME : 236.26 (+2.61%)
AMETEK Increases Quarterly Dividend

BERWYN, Pa. , Feb. 12, 2026 /PRNewswire/ -- AMETEK, Inc. (NYSE: AME) today announced its Board of Directors has approved a 10% increase in its quarterly cash dividend on common stock to $0.34 per...

AME : 236.26 (+2.61%)

Barchart Exclusives

Applebee’s and IHOP Owner Dine Brands Looks Ripe For A Buyout
Dine Brands has already rallied on activist pressure, but with Applebee’s and IHOP still trading below their strategic value, private equity could be the next catalyst. Read more
Want to use this as
your default charts setting?
Save this setup as a Chart Templates
Switch the Market flag
for targeted data from your country of choice.
Open the menu and switch the
Market flag for targeted data from your country of choice.
Want Streaming Chart Updates?
Switch your Site Preferences
to use Interactive Charts
Need More Chart Options?
Right-click on the chart to open the Interactive Chart menu.
Use your up/down arrows to move through the symbols.