
- The cool kids in the analysis industry are all turning bearish corn these days, with one argument being demand is going away.
- However, I am neither cool nor a kid, and looking at the different aspects of the corn market itself tells me a different story.
- The key, as usual, is the Barchart National Corn Basis and Price Indexes, are best reads or real fundamentals.
I will always be able to say I had the privilege to not only be hired by but work with Urban Lehner. If you are unfamiliar with Urban, feel free to drop me a line and I can fill you in what I know about him. A quick summary is he had been an Editor-in-Chief for the Wall Street Journal before taking over an ag newsroom, and the rest is history. Not only did Urban encourage me to start writing more, but he provided a number of lessons along the way. One of them was “Explain, explain, explain.” In other words, even if you’ve said it once, or hundreds of times, explain it anyway because it might be someone’s first time hearing it.
I thought about this pearl of wisdom again Monday morning. After doing a radio interview with a good friend in southern Illinois, he told me a story. His wife had been reading an article from a different analyst (Why? I don’t know.), and this other analyst was basically boasting about how bearish they had become in the corn market. Demand was being destroyed and supplies were being rebuilt almost daily. My friend asked me my thoughts, and I told him, “That’s why I don’t get invited to do panel discussions anymore.”
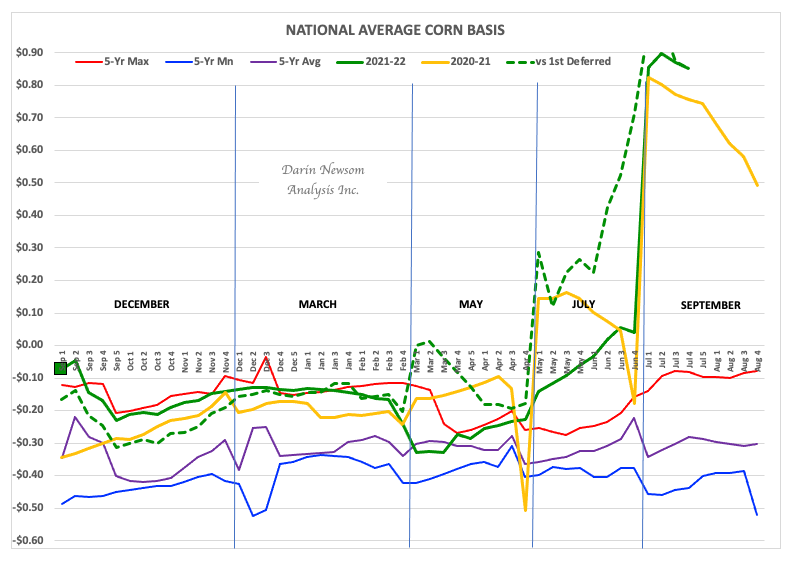
You might recall a recent piece where I talked about how demand for corn and crude oil was not being destroyed as we speak. But in case you missed it, I want to say it again; or explain, explain, explain as Urban taught me to do. How do I know demand for US corn is not being destroyed, at least not as we speak this last week of July 2022? Basis. It’s that simple. As I reread my previous piece I realized I forgot to include the seasonal weekly close-only chart for the Barchart National Corn Basis Index (ZCBAUS.CM), instead doubling up on corn sales and shipments chart (My apologies, but a good reminder of how important editors are). Last Friday saw the NCBI calculated at 85.2 cents over September futures, an incredible number if we consider a year ago during the historic run by corn basis the NCBI came in at 75.6 cents over for the same week. Additionally, the previous 5-year average weekly close for last week (not counting 2021) was 8.2 cents UNDER September.
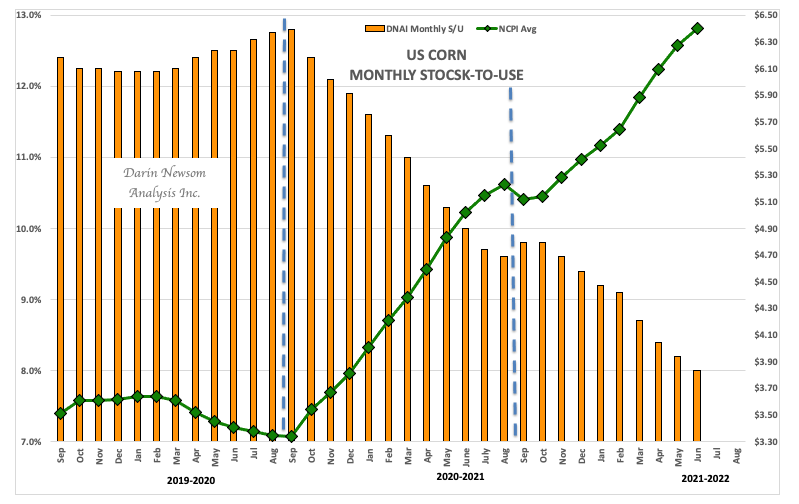
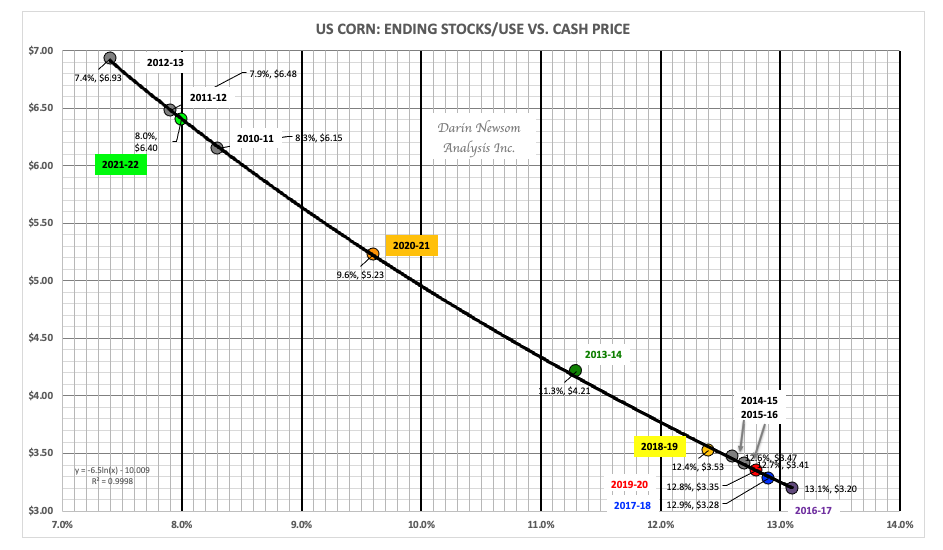
Why is the NCBI so strong? Two reasons: First, demand remains strong, and second, supplies remain tight. The end result is the US available stocks-to-use situation continues to tighten. Using daily calculations for the Barchart National Corn Price Index (ZCPAUS.CM) up to Monday shows a marketing year average price of $6.40, just a few pennies away from the second highest marketing year average of $6.48 registered during 2011-2012. That year my final stocks-to-use came in at 7.9% as compared to this marketing year’s 8.0% with just over a month remaining. Sitting out on its own is 2012-2013 at $6.93 and 7.4%. And if Mother Nature doesn’t cooperate for the 2022 crop, who’s to say we don’t make a run at the record next year?
Here's the real situation late in 2021-2022:
- The strength of the NCBI continues to tell us demand is still strong for US corn.
- And if areas are starting to see weaker demand, it is likely due to a lack of supplies
- How do we know long-term supplies are still an issue? The Dec-July futures spread is covering only 16% calculated full commercial carry.
- With 33% or less considered bullish, meaning commercial traders are still concerned about long-term supplies in relation to demand.
- And that supply AND demand relationship is related to us in the continued strength of the NCPI
Will demand weaken at some time? Yes, it almost always does. Have we reached the tipping point yet? No, not but what the various aspects of the market is showing us.
More Grain News from Barchart
/Dell%20Technologies%20by%20Poetra_RH%20via%20Shutterstock.jpg)
/The%20sign%20for%20Marvell%20Technology%20out%20front%20of%20a%20corporate%20office%20by%20Valeriya%20Zankovych%20via%20Shutterstock.jpg)

/Intel%20Corp_%20badge%20holder-by%20hasrul_rais%20via%20Shutterstock.jpg)
