- My definition of a market bubble is when the futures market loses contact with its underlying cash market, or intrinsic value.
- While we've seen this key the long-term downtrends in US stock indexes, it does not appear to be the case in many of the key commodity markets.
- Additionally, demand for these same commodities remains strong, as indicated by the differential between cash prices and futures.
Last weekend found me in a number of conversations on the social media site Twitter, where somehow or other I found myself in disagreement with nearly everyone. One of the misunderstandings was simple enough, the other gentleman had commented the bubble had burst for grains and oilseeds. Taking the word “bubble” literally, I pointed out that corn and soybeans had not been in a market bubble so therefore no such thing could’ve burst. Given both markets remain in freefall as of Thursday afternoon, the difference in our arguments seems irrelevant, but is it?
By definition, or at least by my definition, a bubble forms when a market loses contact with its intrinsic value. A clearer case would be US stock market indexes, with all three posting bearish long-term reversal patterns this past January after nearly two years of stock prices pulling away from their individual market value. A side note here: This point also starts arguments among those using different measures for the value of companies. The most common argument for the market bubble relies on the classic price/earnings ratio that could incredibly inflated during 2020 and 2021.
However, that was not the case for a couple of Kings of Commodities, corn and crude oil (CLU22), and we could throw soybeans in for good measure. When studying the crude oil markets (Brent and WTI), we can compare futures prices to the cash OPEC basket (Brent) that was recently running $4 over (cash over futures) and the cash price at Cushing (WTI) that was reportedly $2 (roughly) over. There were reports last week, while crude oil futures were in freefall, that those looking to buy cash oil couldn’t get it bought due to continued tight supplies.
When it comes to corn, soybeans, and the three wheat markets I use the Barchart National Price Indexes for the intrinsic value of the markets, with the price difference between these indexes and futures reflected in the Barchart National Basis Indexes. Of the 5 major markets, the one that jumps out at me is corn. Thursday afternoon saw the Barchart National Corn Price Index (ZCPAUS.CM) calculated at $6.6105, putting the differential between cash and nearby September futures at 85.3 cents. This is an incredibly strong basis reading, outdistancing last year’s historic market that was calculated at the end of this week at 75.6 cents over.

If cash markets remain strong in relation to futures, why are futures falling so hard and fast? One argument is the recent rally to $8.27 by corn futures (May contract) and $130.50 in crude oil (April contract) destroyed demand, similar to what we saw play out in 2008. But I disagree. In fact, I argue that the strength of basis for these two key markets indicates demand remains red hot. In crude oil, refiners continue to run at near maximum capacity to produce gasoline and distillates, with no slowdown seen in demand for either market at this point.
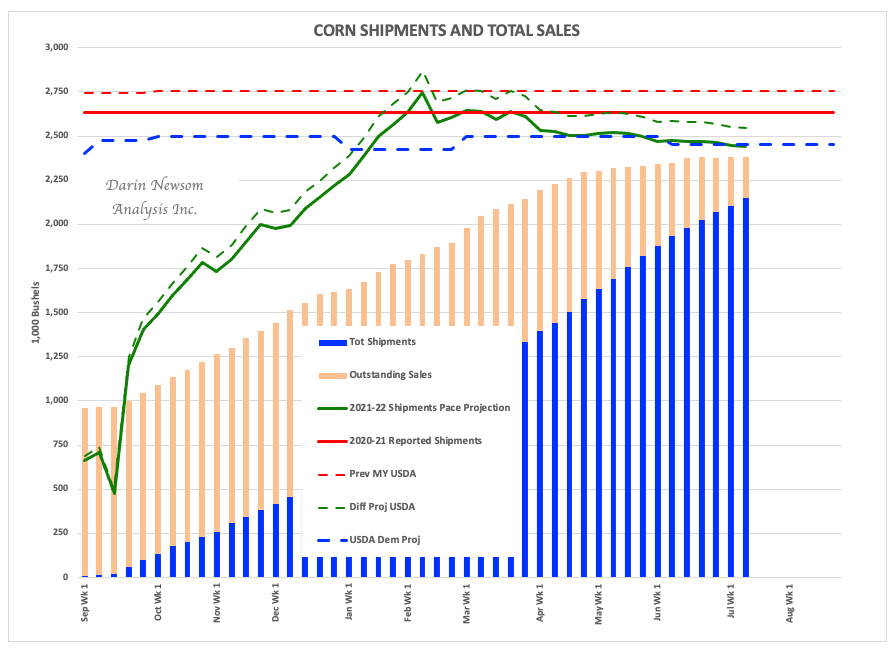
US corn’s 3-legged demand stool of ethanol, feed, and exports is showing no sign of cracking at this point either. While ethanol demand could start to slow due to a seasonal drop in driving, I’m getting reports interior merchandisers, including those at ethanol plants, are pushing basis almost daily. Down in the Southern Plains, feed yards can’t find enough corn to feed the increased number of cattle placed due to the ongoing drought. As for exports, the most recent weekly export sales and shipments update (for the week ending Thursday, July 14) showed the US on pace to ship 2.44 bb during 2021-2022. With 2.14 bb already shipped, exporters need to find another 300 mb somewhere to load onto ships and or trains.
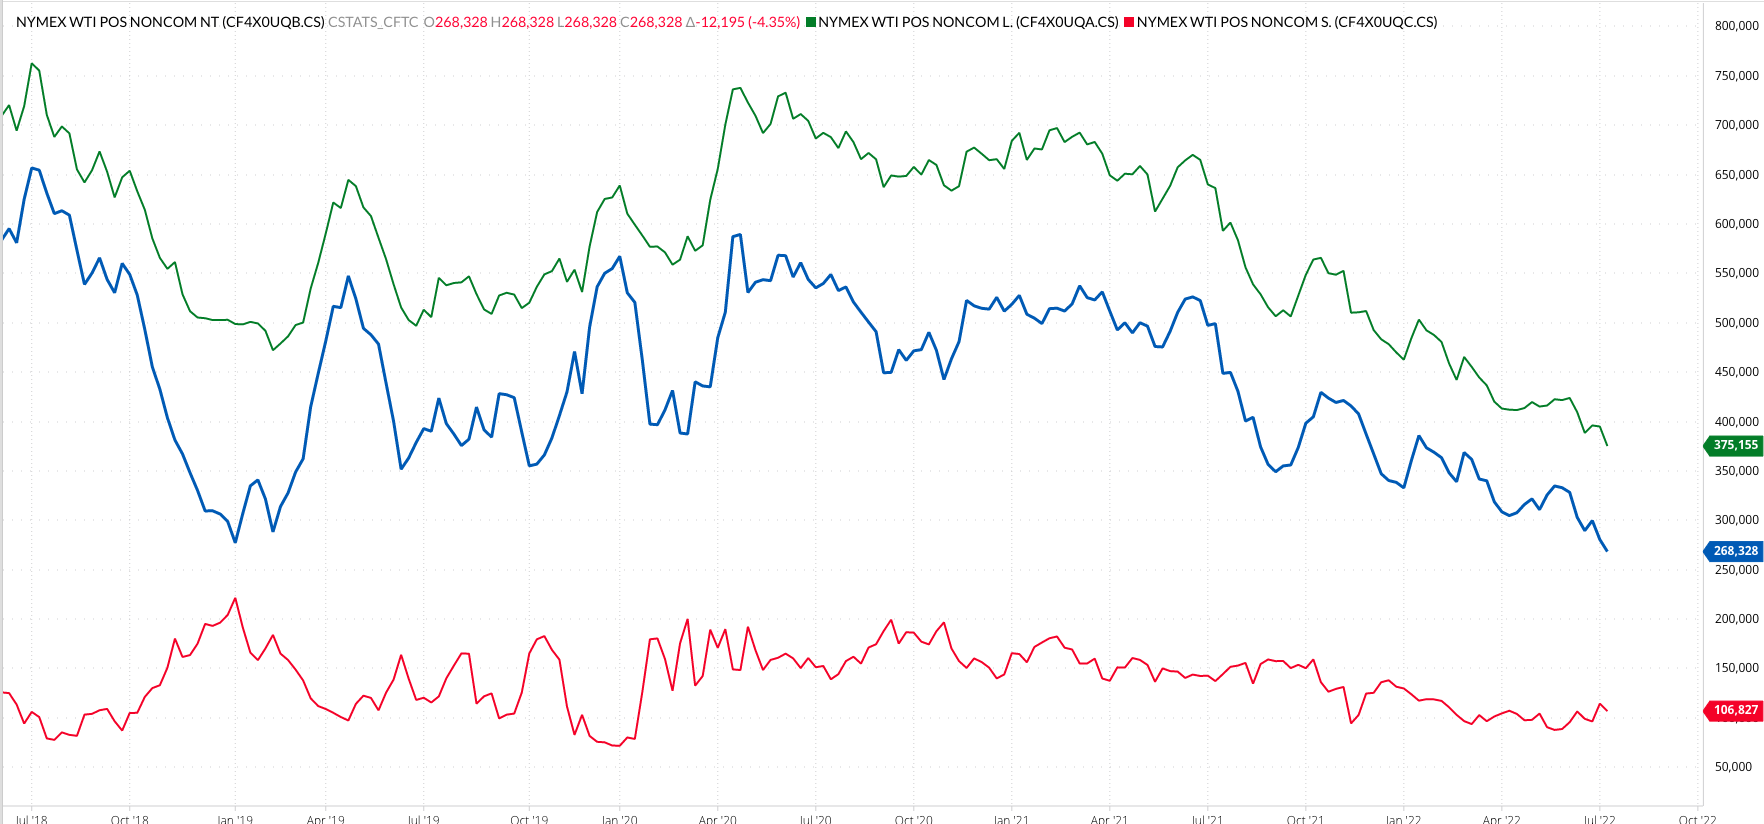
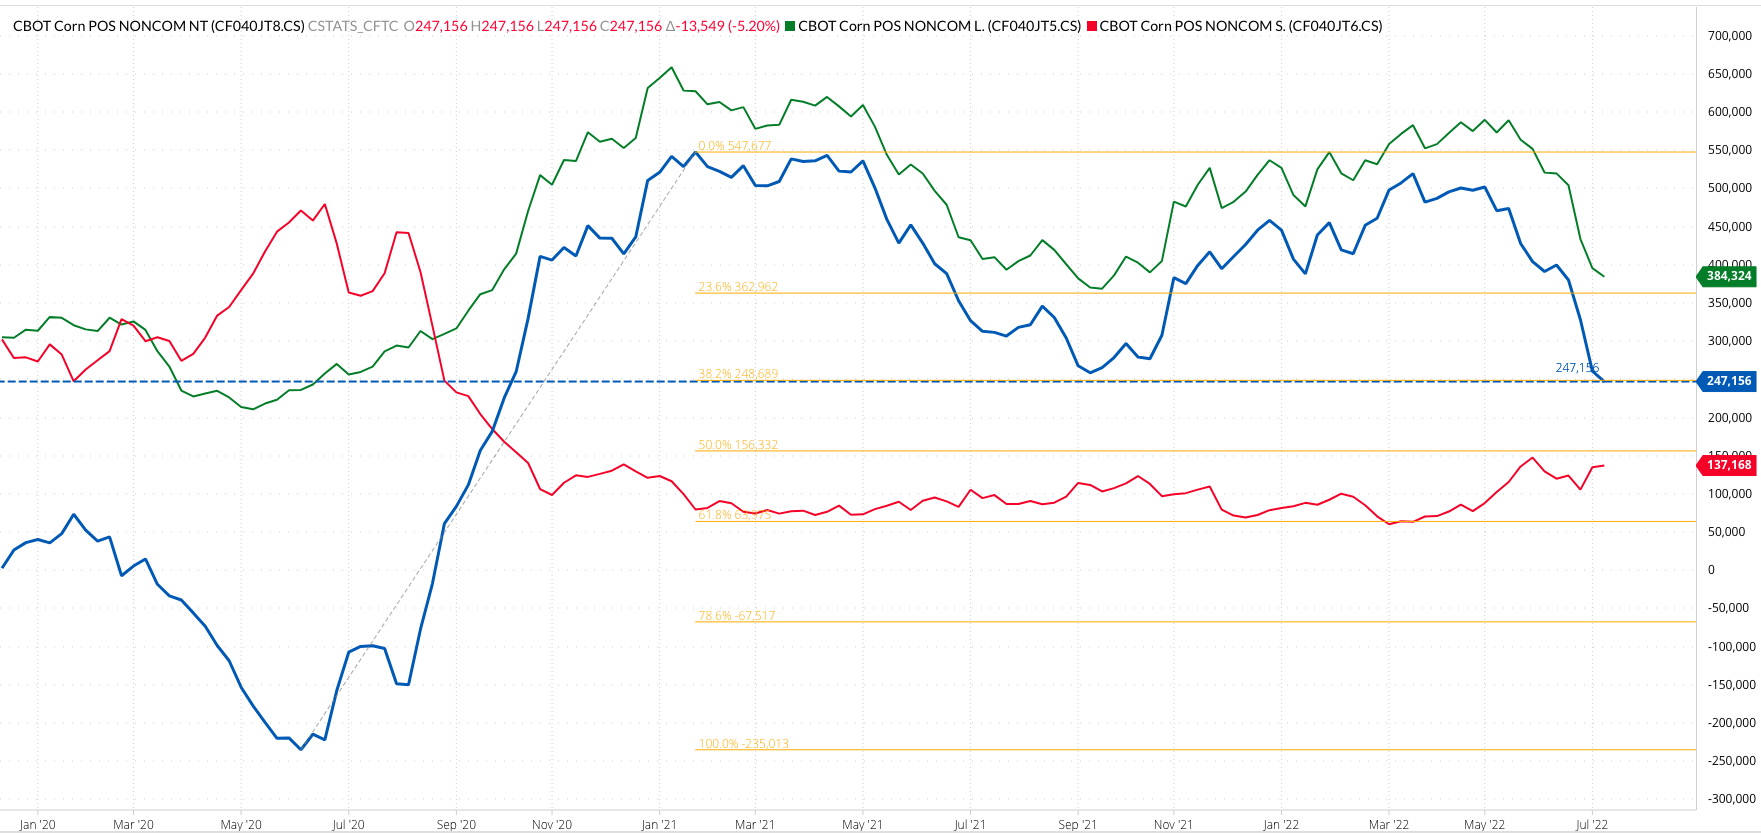
Where, then, has the pressure come from? Consider the noncommercial net-long futures positions for the two markets have decreased by 54% (crude oil) and 52% (corn), the latter since just this past March. Therefore, the only “demand” that has been destroyed has been paper, as opposed to physical, with investors chased out by central banks raising interest rates around the world and the aforementioned downtrend in US stock indexes. Will this group return? Theoretically, yes, given the number of commodity markets still showing long-term bullish supply and demand situations. But they don’t have to, and considering how many of these same commodities have established long-term downtrends on their respective monthly charts recently, indications are the great commodity bull run has come to and end.
Despite continued bullish fundamentals, and the fact a bubble never existed.
More Grain News from Barchart

/AI%20(artificial%20intelligence)/Ai%20chip%20by%20Quality%20Stock%20Arts%20via%20Shutterstock.jpg)