
In the US, the corn market remains the King of the Ag sector given the country is the world leader in production, usage, and exports.
In its January WASDE report, USDA did what it was supposed to do: Generate trade volume and break the US corn market.
Based on our reads on real supply and demand, the corn market didn't change. However, given the manufactured reaction by the noncommercial side, the price range did change. At least for now.
This Weekly Column will be different than most. There won’t be any little puns, or pop culture references, or song lyrics. There is time for having some fun with commentary, and there is time to be serious. As we get set to sail on a new week, we are left with the latter, as the manufactured meltdown of one of the most important markets in US agriculture changed the playing field. A number of years ago, the theme of my Outlook presentation at the annual Ag Summit was “The Domino Effect”. I talked about if the corn market was the first domino to fall, then eventually the rest of US agriculture would follow. Though I’m not a fan of USDA’s WASDE reports, particularly this past week, for comparison of projected units to be exported, as opposed to gross value, we saw:
- Corn estimated at 81.28 million metric tons (mmt)
- Soybeans at 42.86 mmt
- All wheat at 24.49 mmt
- Soybean meal at 17.6 mmt
- Cotton at 12.2 mmt
- Pork at 3.2 mmt
- Beef at 1.1 mmt
A quick look at this list and we see US corn exports nearly equal the next 6 markets added together. There’s a good reason corn is King when it comes to US agriculture: The US is the world’s producer, user, and exporter, and it isn’t even close. Therefore, what happens in corn will certainly have a ripple effect to the rest of the sector, and the industry as a whole. Which brings us back to last Monday (January 12).
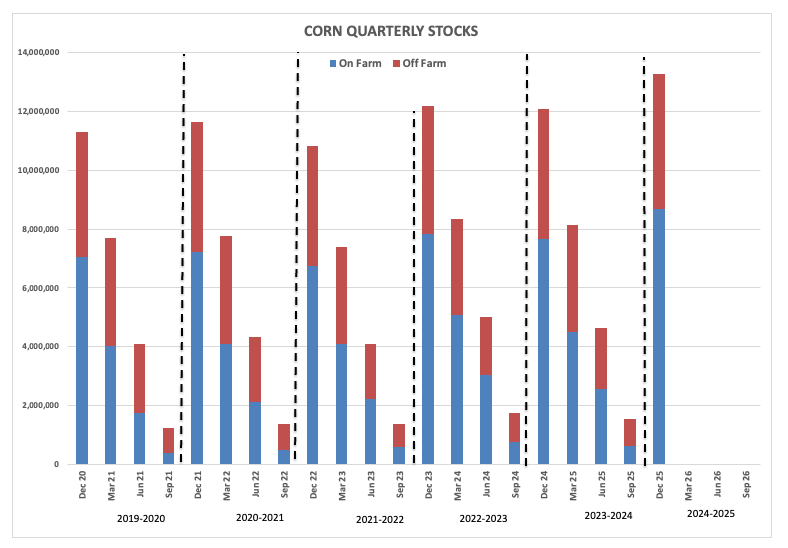
When USDA released its January WASDE report, US corn production jumped from the previous 425.53 mmt (16.75 billion bushels) to a record 432.34 mmt (17.02 bb), an increase of 1.6%. Carrying the numbers out to the ledger's end, US ending stocks were increased to 56.56 mmt (2.23 bb), theoretically putting ending stocks-to-use at 13.6%, what would be the largest ending stocks-to-use figure – again theoretically – since the end of the 2008-09 marketing year at a reported 13.9%. Not only that, but quarterly stocks as of December 1 were pegged at 13.28 bb, also the largest December 1 figure on record.
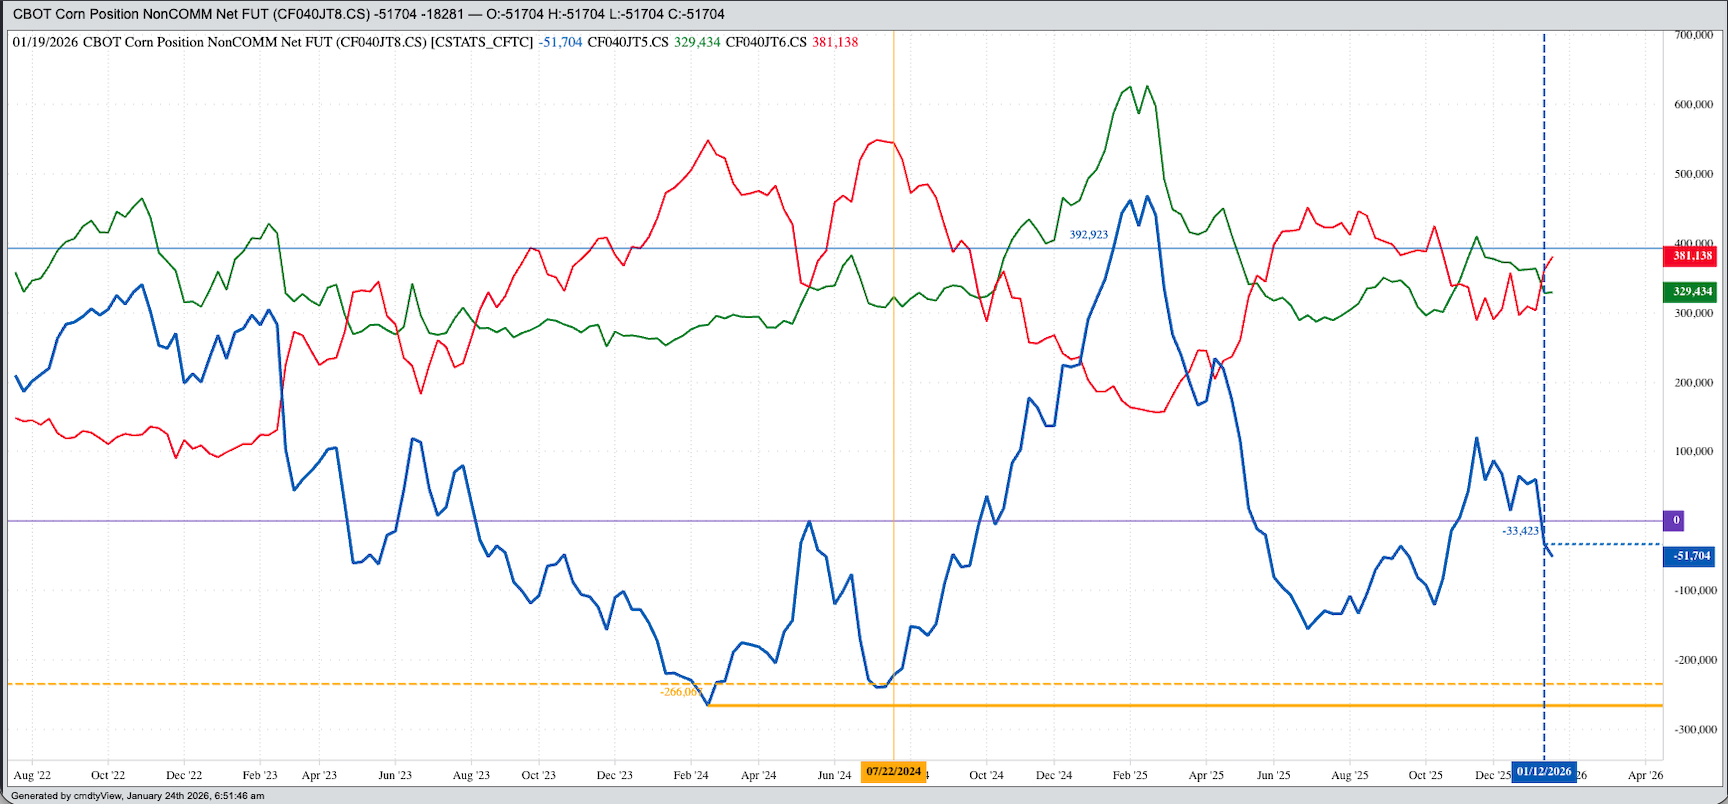
The question asked more than any other: Were USDA’s numbers right? My answer: It doesn’t matter. It has never mattered, but now less so than ever. All that matters is the numbers generate a response from trade algorithms, and to that we can say, “Mission accomplished”. There’s a reason these reports are released during business hours: Trade volume. Last Monday (January 12), the CME reported trade volume in the corn futures market alone of 1,059,630 contracts. This was the largest daily volume number since March 29, 2019, also a USDA report day (quarterly Grain Stocks). When the latest CFTC Commitments of Traders report (legacy, futures only) was released, for the week ending Tuesday, January 13, the day after WASDE, noncommercial traders held a net-short futures position of 33,423 contracts, a switch of 93,535 contracts from the previous week. This switch, amounting to roughly 468 mb, included a decrease in long futures of 35,327 contracts and an increase in short futures of 58,208 contracts.
The follow-up question was usually: Were our reads on corn’s real fundamentals indicating as bearish a scenario as USDA came up with? No. Let’s look at them one by one:
- At the end of November, the National Corn Index ($CNCI) was priced near $4.02, below its previous 5-year end of Q1 (September-October-November) low price of $4.06 but above the 10-year end of November low of $3.01. It was a similar scenario at the end of December with the Index again priced near $4.02 versus the 5-year low of $4.32 and 10-year low of $3.12.
- Weekly closes of the national average basis market have been running below the trendline of previous 5-year lows but generally above previous 10-year low weekly closes.
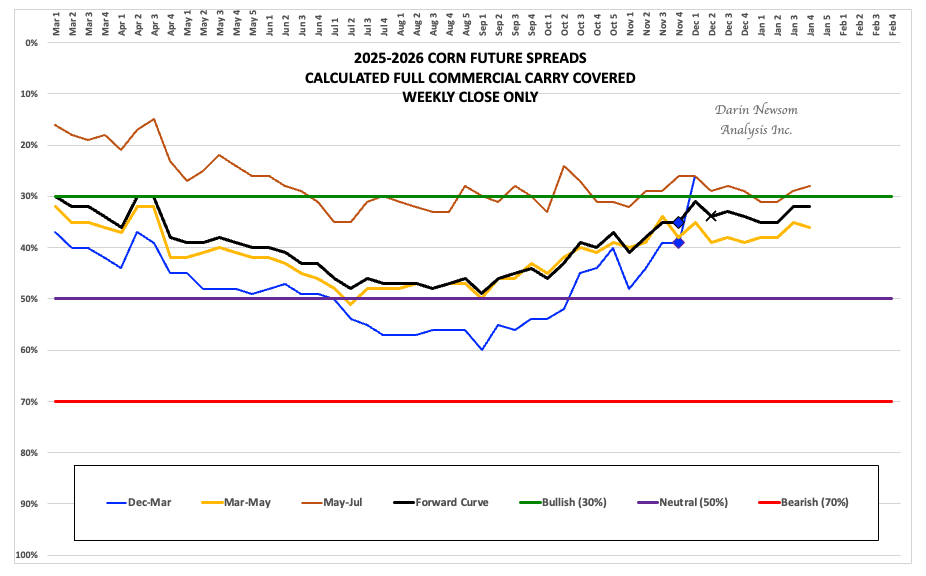
- The initial 2025-26 December-March futures spread covered as much as 60% calculated full commercial carry during the heart of the 2025 harvest, not quite reaching the bearish level of 70%. Further out, the May-July futures spread has covered a bullish level of calculated full commercial carry since mid-July.
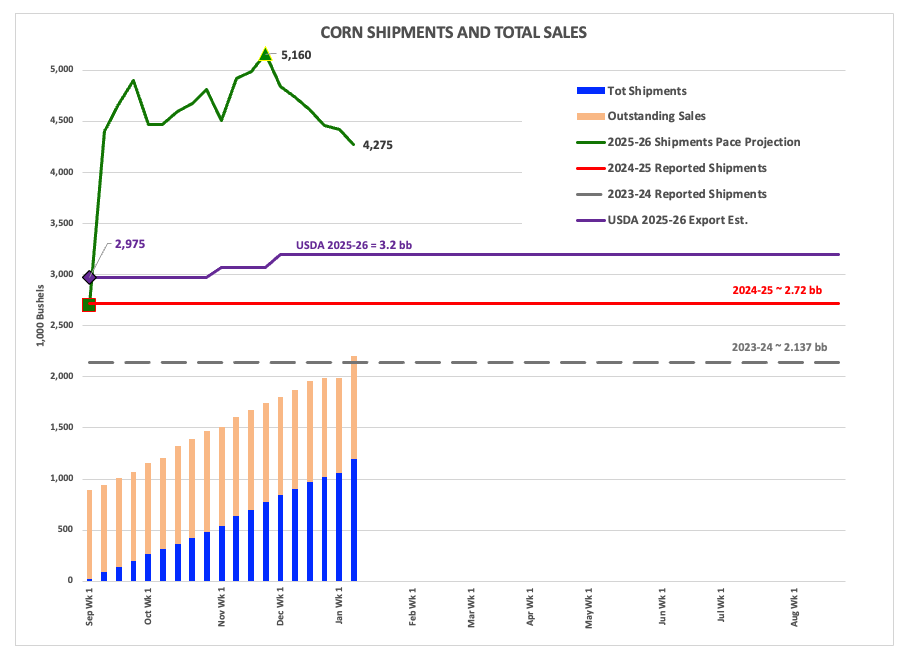
The bottom line from our reads on real fundamentals is this: The US produced a big crop, how big is irrelevant. However, since the National Corn Index, national average basis, and futures spreads did not collapse we have known that regardless of how big the crop was, demand has held available supplies in check since last harvest. And given feed demand remains light due to a smaller US cattle herd, and ethanol demand remains under pressure from the petroleum friendly US administration, the spotlight is on exports. Through the end of November (Q1), total US shipments projected marketing year export demand of 5.16 bb, an increase of 90% from 2024-25’s reported shipments of 2.72 bb. By the end of December, the pace projection had slipped to 4.85 bb, still up 78% from last year.
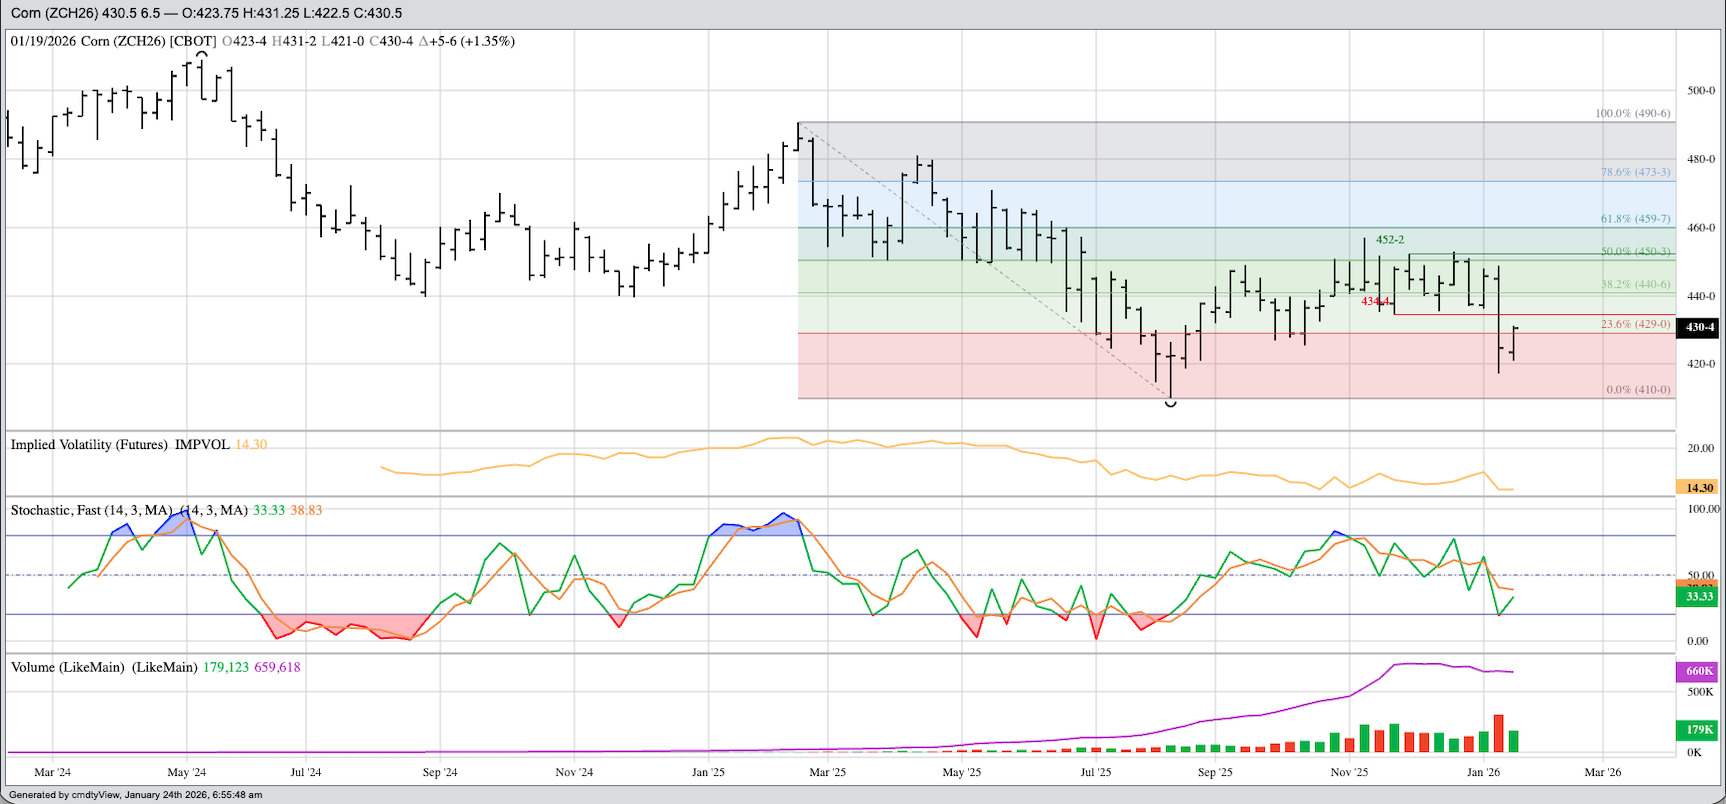
Nevertheless, the corn market saw its price levels reset due to USDA’s questionable numbers. On its intermediate-term weekly chart, the nearby March futures contract (ZCH26) broke out of its sideways range between roughly $4.30 and $4.60 as it fell to a low of $4.1725 on noncommercial selling. The new-crop December issue (ZCZ26) fell back to $4.4525, opening the door to a possible test of $4.40 over the coming weeks with its key major low at $4.3875 from the last week of August.
But here’s where things could stay interesting. Recall Market Rule #6 tells us: Fundamentals win in the end. Given funds have moved to a net-short futures position while real fundamentals are mixed (weak Cash Index and basis, neutral-to-bullish futures spreads), it would not be surprising to see the noncommercial net-futures position go long again over the coming weeks. The issue is, it takes weeks, if not months, for the corn market to rally and only a matter of hours to collapse.
The third most popular question I was asked last week was if this round of USDA imaginary numbers would be the most bearish traders see the rest of the year. Theoretically, yes, but we have to keep in mind the US has mid-term elections coming up in November and the US president has demanded lower food prices. As I talked about at the top, based on the Domino Effect, the easiest way to lower food prices is to crush the US corn market, something easily done when algorithms are tuned to official agency numbers.
One last thing before I go. You remember well what I’ve said in the past: Traders, Watson in particular, do not care if market price is below breakeven, whatever that price may be. Their job is to make money. We’ll see how this plays out over the coming weeks and months.
On the date of publication, Darin Newsom did not have (either directly or indirectly) positions in any of the securities mentioned in this article. All information and data in this article is solely for informational purposes. For more information please view the Barchart Disclosure Policy here.
/NVIDIA%20Corp%20logo%20outside%20building-by%20BING-JHEN_HONG%20via%20iStock.jpg)
/Microsoft%20headquarters%20By%20Peter.jpeg)
/Micron%20Technology%20Inc_%20logo%20on%20building-by%20vzphotos%20vis%20iStock.jpg)
/Amazon%20-%20Image%20by%20bluestork%20via%20Shutterstock.jpg)