
Wheat Analysis & Targets
There are two methods we use at ONE44 to find support and resistance in the markets.
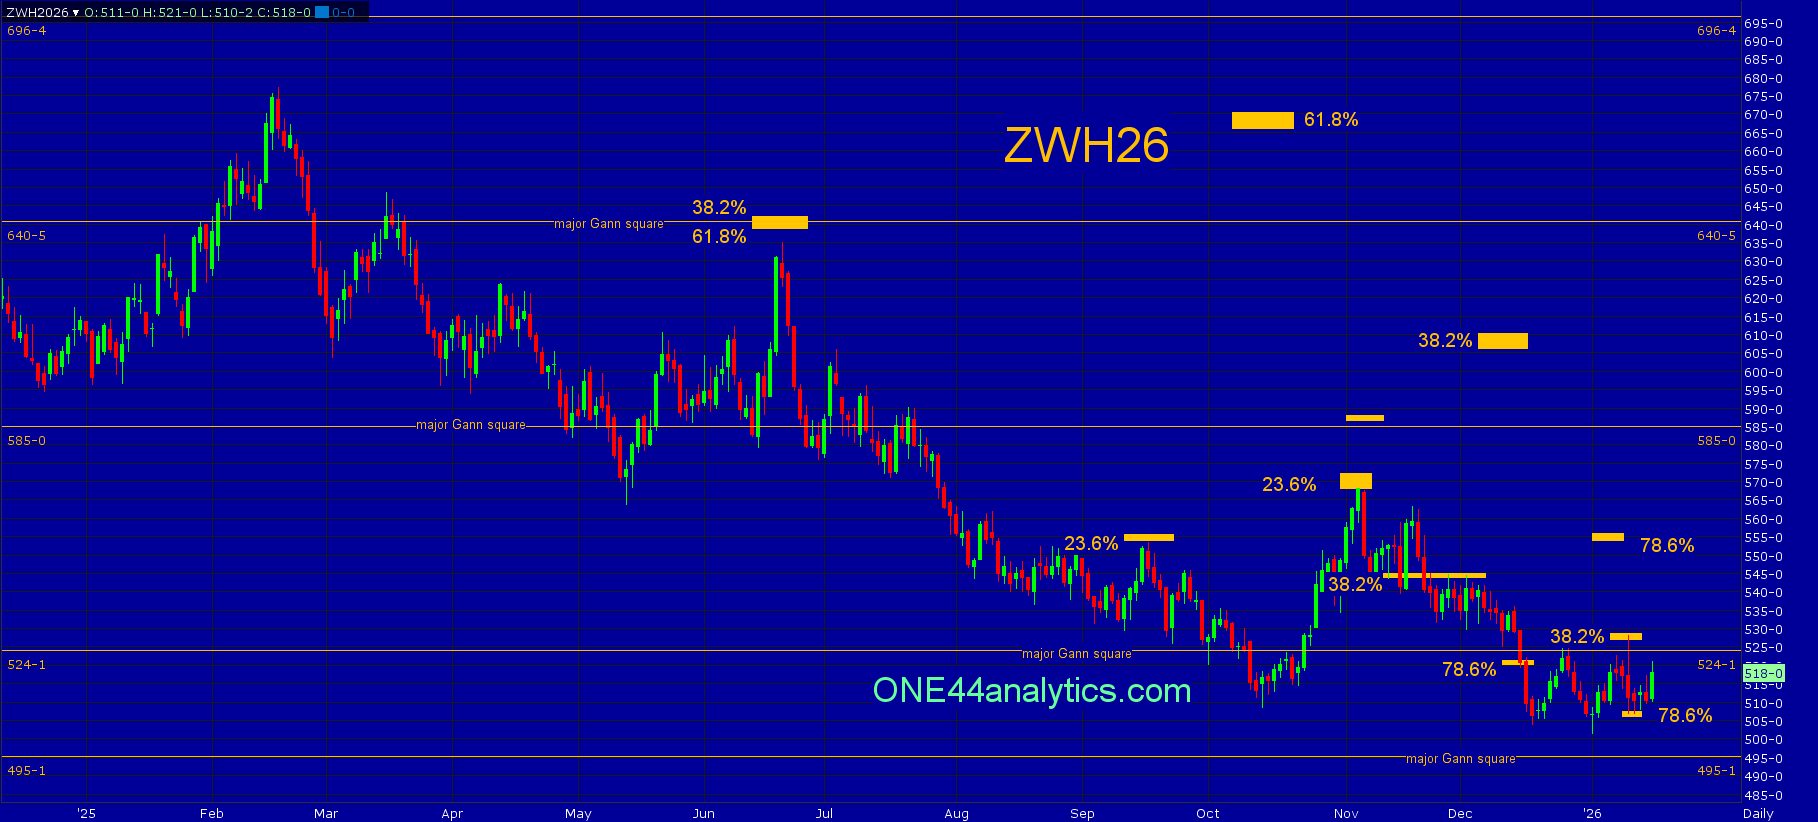
The first are major Gann squares, these are the yellow horizontal lines on the chart.
The second is Fibonacci retracements.
.
This is the ONE44 Analysis for Wheat using these methods.
Wheat
March
From the 1/12/26 Special Update,
From last week,
It put out a new low for the bear market and that again lowers the retracements above. We are looking for the first sign of a possible trend reversal and that could come by taking out 38.2% back to the 11/5/25 high (23.6%) at 527.00, so this will be the key level for the week.
Use 527.00 as the swing point for the week.
Today's high hit the 527.00 (38.2%) swing point and broke 20 cents keeping the short trend negative. It hit 78.6% back to the low at 507.00 This will be the key level for the week. It is a very tight range to use a 78.6% retracement, however if it can hold, it can be the start of the next leg up.
Use 507.00 as the swing point for the week again.
Each low this week held the 78.6% swing point at 507.00 and this will again be the key level for the week. Provided this level can hold it can be the start of the next Bull run (ONE44 78.6% rule). With no new low all the Above/Below Targets remain the same.
.
Use 507.00 as the swing point for the week again.
Above it, it still needs to take out 527.00(38.2%) to turn the short term trend positive. Provided it can, the short term target is 78.6% of the same move at 554.00. The longer term target is the 585.00 major Gann square. The long term target is also the long term swing point at 606.00, this 38.2% back to the 5/22/24 high.
Below it, a failure to turn back up from this area will give us only major Gann squares to look for support and then use as the swing point when closed below, the next two are 495.00 and 465.25.
ONE44 Analytics where the analysis is concise and to the point
Our goal is to not only give you actionable information, but to help you understand why we think this is happening based on pure price analysis with Fibonacci retracements, that we believe are the underlying structure of all markets and Gann squares.
If you like this type of analysis and trade the Grain/Livestock futures you can become a Premium Member.
You can also follow us on YouTube for more examples of how to use the Fibonacci retracements with the ONE44 rules and guidelines.
Sign up for our Free newsletter here.
FULL RISK DISCLOSURE: Futures trading contains substantial risk and is not for every investor. An investor could potentially lose all or more than the initial investment. Commission Rule 4.41(b)(1)(I) hypothetical or simulated performance results have certain inherent limitations. Unlike an actual performance record, simulated results do not represent actual trading. Also, since the trades have not actually been executed, the results may have under- or over-compensated for the impact, if any, of certain market factors, such as lack of liquidity. Simulated trading programs in general are also subject to the fact that they are designed with the benefit of hindsight. No representation is being made that any account will or is likely to achieve profits or losses similar to those shown. Past performance is not necessarily indicative of future results.


/A%20close-up%20of%20an%20AMD%20office%20by%20gehapromo%20via%20Adobe%20Stock.jpeg)