
The information and opinions expressed below are based on my analysis of price behavior and chart activity
Sign Up to receive Walsh Trading’s 1st Half of 2026 Market Outlook First Half of 2026 Outlook for the Livestock and Grain markets.
Tuesday, January 6, 2026
Can Corn catch a rally to start this new year?
If you like this article and would like to receive more information on the commodity markets from Walsh Trading, please use the link to join our daily email list -Click here
March Corn (Daily)
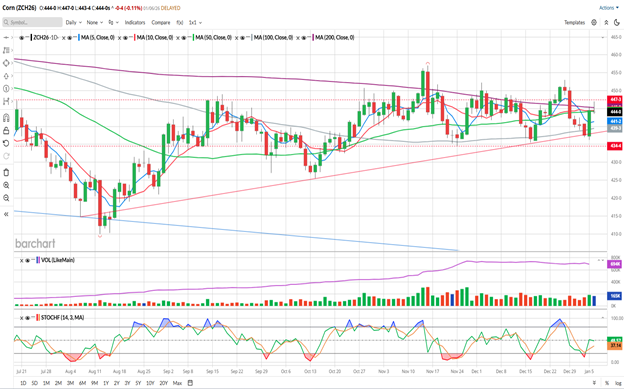
Today, March Corn closed at 4.44, dropping just ½ cent. The first full week of 2026 started with a large bullish engulfment on Monday and a gain of 7 cents. Yesterday’s trade activity saw the 100-day moving average (grey, 4.39 3/8) support hold, along with the red trendline support that I’ve drawn on the chart. The 200-day moving average (purple, 4.45 ¼) held as resistance yesterday and today. Today’s settlement was just below the 50-day average (green, 4.44 ¼) and the 10-day-average (red, 4.44 3/8) but above the 5-day average (blue, 4.41 ¼). Today’s open and close were the same, posting a Doji on the candlestick charts. Typically, I’d wait for a directional move or close outside of today’s range (4.47-4.43 ½) and use a buy stop above, along with a sell stop below, the daily range to enter into a long or short position.
By looking at the chart, you might agree that this market hasn’t made any significant moves since September. I’ve drawn two dotted horizontal lines bracketing the range from Sept. 12th. To my eye, the majority of trade since that date has been in that highlighted range of 4.47 ½ - 4.34 ½. A rough count tells me that we traded below that range on 12 days and traded above that range on 25 days. That seems to favor the bulls, in my opinion, but the market has really been unable to break out of that range and make an extended push, one way or the other. So which way will it go?
The long-term trend, as measured by the 200-day average, is still bearish, and that average still appears to be declining. The medium-term 100-day average is inclined higher and has acted as support the last three times it has been tested. The 50-day trend is also inclined higher, but is just above today’s close. The 50- and 100- made a bullish crossover on October 30th, while the 5- and 10-day averages made a bearish crossover on January 2nd, last Friday.
We’re finally seeing the USDA get caught up on the Export Sales reports. This coming Thursday’s data should be as current as we can get from them. I think the same is true for the Commitment of Traders data, with this coming Friday’s data being as current as they can give us. The most recent releases show that export sales in Corn are well above the 5-year average and also above the pace set last year. Exports and domestic consumption are in good shape, to my eye. Fund traders are net short, as of December 30th, which seems to be a recent reversal in their positional direction.
Seasonally, March Corn prices tend to trend higher through the month of January and maintain that strength until, roughly, the March options expire. This year they expire on February 20th. You can view Barchart’s seasonal data here.
Next Monday, January 12th, will see the release of the of the USDA’s Supply/Demand, Grains Stocks and Crop Production reports. The January report is usually (not always) when we see the USDA start to adjust their yield figures. I haven’t seen enough estimates yet to get a consensus yet, but I think that the USDA will trim the crop size back from 186 bushels per acre and the 16.75 billion bushel crop they’ve been forecasting. I think it will still be a record harvest (less than 16.75) due to increased acres being planted, but I think the average yield should get reduced a bit, perhaps closer to the 180 bpa average. My expectation is for a bullish report and a bullish reaction from the market.
Producers that still have bushels in the bin still should protect the downside risk. March Corn Put options expire in 45 days, but the shorter-term February options expire in 17 days and offer less cost out-of-pocket. The 435 strike prices, which should protect you against a bearish washout (see: Soybeans since the middle of November) are priced at 6 cents or $300 for the March expiry and 3 cents or $150 for the February. You’ll need to factor in your commissions/fees. Keep an eye on the option deltas to ensure that you get proper protection against the bushels you need to cover. To my mind, you’ll need 3 or more to adequately cover 5,000 bushels. That 435 strike is just above the low posted on November 24th.
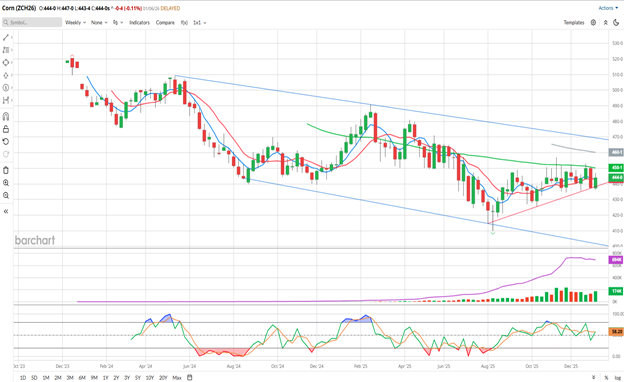
Aggressive and well-margined speculators may do well to consider long positions in the futures. Perhaps a Buy near 4.40 with a 6 cent ($300) risk, before your commissions/fees, to 4.34 would serve you well. That would give you the chance to enter a little lower and risk a new low for the move. March Corn hasn’t traded down to there since October 23rd. For an upside target, perhaps reference the weekly chart below. The 50-week average (green on the chart below) near 4.50 might be a reasonable target and a nice, fat, round number to shoot for, and would result in a $500 gain, before commissions/fees. A more aggressive target might be that upper blue trendline on the weekly chart, which would be closer to 4.70. If the market has some pent-up energy since it’s been sideways for the past quarter, I don’t think that’s too big of a stretch. That would result in a 30 cent gain or $1,500 per contract, before your commissions/fees. If 2026 starts like 2025 did, I don’t think that’s out of the question. Look at the weekly chart below and you might notice a move from about 4.40 at the beginning of December ’24 to the high of the past year, in the middle of February ’25, at 4.90.
March Corn (Weekly)
Sign Up to receive Walsh Trading’s 1st Half of 2026 Market Outlook First Half of 2026 Outlook for the Livestock and Grain markets.
If you like what you’ve read here and would like to see more like this from Walsh Trading, please Click here and sign up for our daily futures market email.
Jefferson Fosse Walsh Trading
Direct 312 957 8248 Toll Free 800 556 9411
jfosse@walshtrading.com www.walshtrading.com
Walsh Trading, Inc. is registered as a Guaranteed Introducing Broker with the Commodity Futures Trading Commission and an NFA Member.
Futures and options trading involves substantial risk and is not suitable for all investors. Therefore, individuals should carefully consider their financial condition in deciding whether to trade. Option traders should be aware that the exercise of a long option will result in a futures position. The valuation of futures and options may fluctuate, and as a result, clients may lose more than their original investment. The information contained on this site is the opinion of the writer or was obtained from sources cited within the commentary. The impact on market prices due to seasonal or market cycles and current news events may already be reflected in market prices. PAST PERFORMANCE IS NOT NECESSARILY INDICATIVE OF FUTURE RESULTS. All information, communications, publications, and reports, including this specific material, used and distributed by Walsh Trading, Inc. (“WTI”) shall be construed as a solicitation for entering into a derivatives transaction. WTI does not distribute research reports, employ research analysts, or maintain a research department as defined in CFTC Regulation 1.71.


/AI%20(artificial%20intelligence)/Image%20of%20server%20racks%20in%20modern%20server%20room%20data%20center%20by%20Sashkin%20via%20Shutterstock.jpg)
/Amazon%20-%20Image%20by%20bluestork%20via%20Shutterstock.jpg)