/AI%20(artificial%20intelligence)/Data%20Center%20by%20Caureem%20via%20Shutterstock%20(2).jpg)
Just when the tech sector seemed to have garnered some momentum following bubble fears in artificial intelligence, the innovation space suffered a rude awakening. One of the biggest victims was data center specialist Applied Digital (APLD). On the surface, the company appears aligned with the broader AI revolution as it provides the infrastructure to run deep learning processes. Unfortunately, mere relevance isn’t always enough to stave off volatility.
To be sure, Applied Digital’s financial risks — which have been compounded by management’s aggressive expansionary efforts — represent the core source of anxiety. However, some underwhelming results from tech juggernauts, most notably Oracle (ORCL), have hurt sentiment for AI-related enterprises. Essentially, market participants have moved on from the low-hanging fruit of paradigm-shifting narratives. Now, they want hard evidence that sector players are making headway.
From a long-term perspective, such anxieties are understandable but potentially misplaced. Unless there is evidence that AI is simply a fad that will lose relevance over time, wholesale destruction of value seems premature. If anything, the evidence points to rising demand for machine intelligence — along with heavy competition to control the supply chains that undergird the innovation.
Despite the carnage, what’s fascinating here is that the smart money doesn’t seem perturbed. Looking at options flow — which focuses exclusively on big block transactions likely placed by institutional investors — net trade sentiment last week was overwhelmingly bullish. We’re talking to the tune of millions of dollars if viewed cumulatively.
As for the latest read, net trade sentiment stood at $367,100. Personally, I think that’s going to tell you a lot more than which individual puts or calls have demonstrated unusual activity.
Based on implied volatility (IV) — which is a residual value calculated from actual option order flows — Barchart’s Expected Move calculator projects a price range (for the month-of-February expiration date) between $15.78 and $30.18. Thanks to the heightened IV, we have a whopping high-low spread of 91.25%.
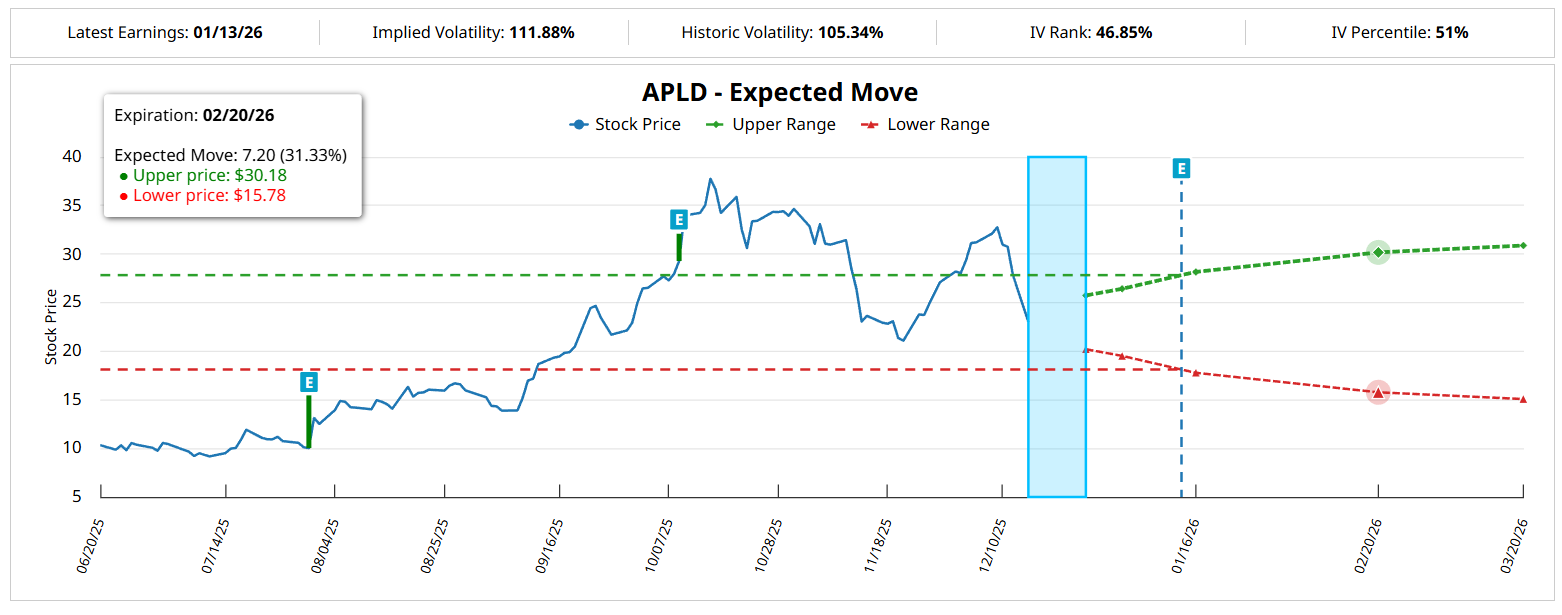
Quite frankly, that’s a massive metaverse. Let’s try to narrow this down.
Shifting Away from Single-Domain Thinking to the APLD Stock Metaverse
For those who simply want to buy and hold APLD stock — like yours truly — introducing the metaverse concept of the markets may be superfluous. However, if you want to trade APLD options, this concept is unavoidable. Just look at the stock’s options chain.
Sure, it’s a market of contracts to buy and sell the underlying but think more foundationally. When people trade options, they’re literally capitalizing the probability risk of alternate realities. Therefore, while options technically expire, it’s more akin to branches of alternate timelines collapsing due to unfolding events making their materialization impossible.
To make a long story short, to effectively navigate the multiverse, you must think in terms of the multiverse.
So, rather than assume a deterministic future, we’re going to stack the historical price data of APLD stock into a distributional format. For example, if we looked at one 10-week cycle, that return won’t tell us much. But if we stacked hundreds of 10-week cycles in a distribution, such an analysis would reveal structure.
How so? One-off events wouldn’t impact the entire dataset because of their rarity. In contrast, if after hundreds of trials certain price levels are more represented than others, that rise in probability density reflects the “physical” structure of demand. More precisely, this risk geometry tells you where traders are more likely to be buyers — and where buyers are tempted to become sellers.
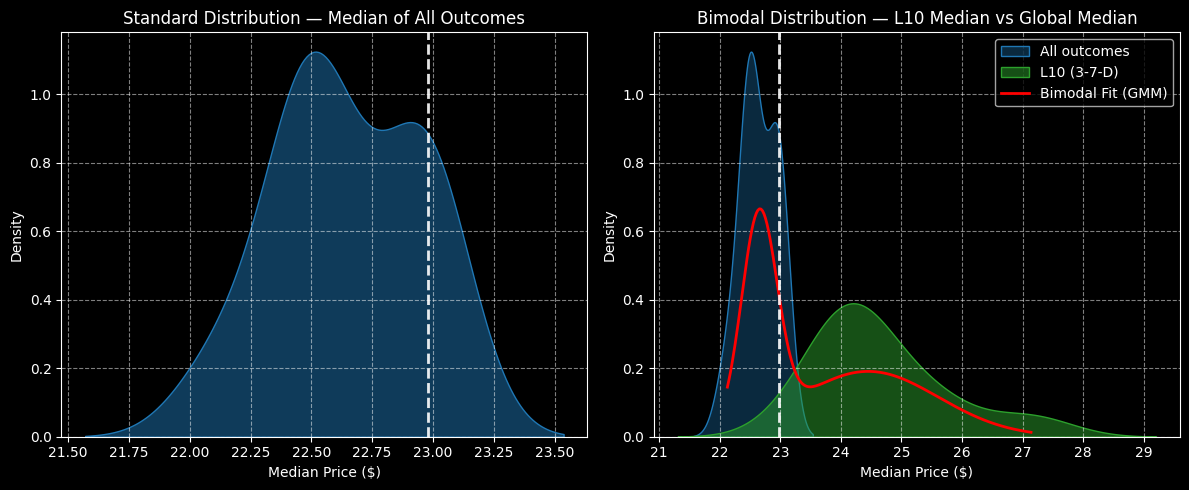
Under a distributional lens, the forward 10-week returns of APLD stock will roughly range between $21.60 and $23.55 (assuming an anchor price of $22.98, Monday’s close). Price clustering would be predominant near $22.50, which would indicate a negative bias.
However, we’re interested in the current quant signal, which is the 3-7-D sequence; that is, in the past 10 weeks, APLD stock printed only three up weeks, thus leading to a downward slope. Following this setup, the 10-week returns may range between $21.30 and $29.20, with price clustering likely to be predominant at around $24.20.
Put simply, traders tend to buy the dip whenever APLD stock suffers extended bearishness.
Being Smart with Your Speculation
Given the risk geometry, you’ll note that the reward tail is incredibly wide. Theoretically, this dynamic implies that traders can get away with being more aggressive. However, because the aforementioned sequence is extremely rare, the statistical confidence in the so-called fat tail is low. Subsequently, you’re likely better off wagering near the center of probabilistic mass.
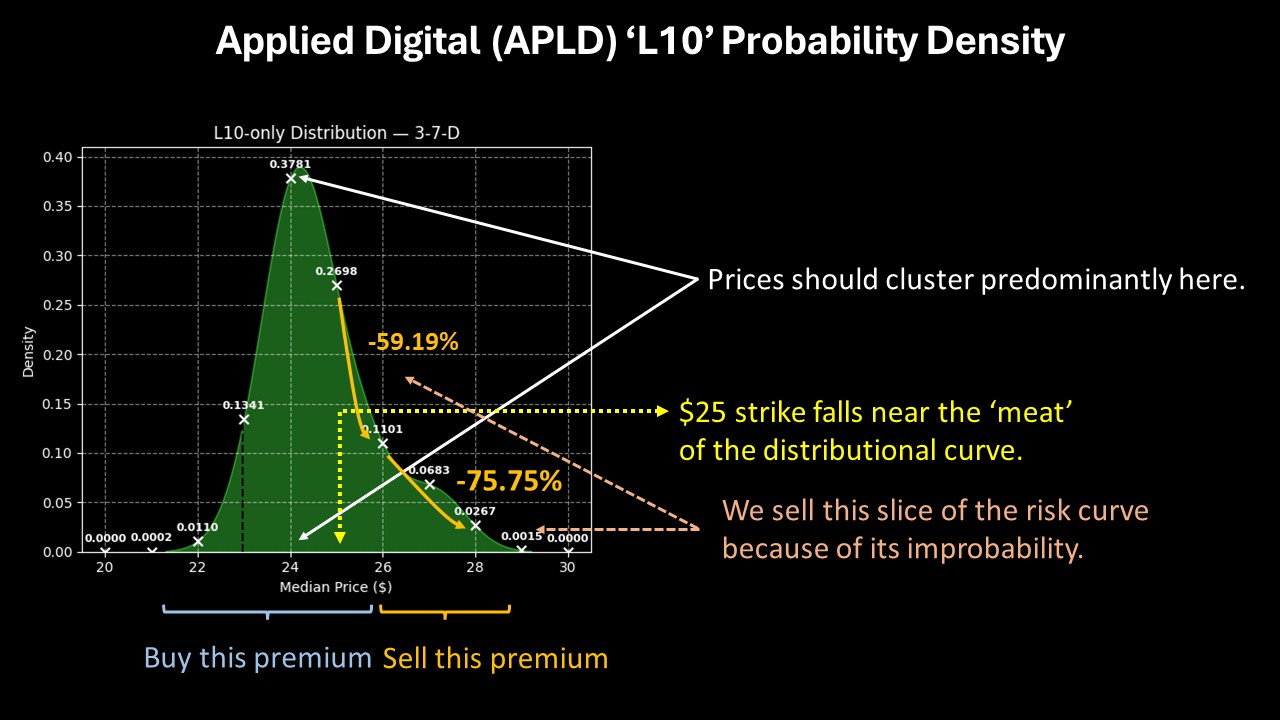
While it’s not the most exciting idea in the world, I believe the smart wager would be the 23/25 bull call spread expiring Feb. 20, 2026. This trade requires two simultaneous transactions: buy the $23 call and sell the $25 call, for a net debit paid of $90 (the most that can be lost).
Should APLD stock rise through the second-leg strike ($25) at expiration, the maximum profit would be $110, a payout of over 122%. Breakeven would land at $23.90, which is right near the thickest part of the probability density curve.
What’s also notable is that probability decay accelerates rapidly above the $25 level. So, while the payout isn’t extreme, on balance, the 23/25 bull spread appears maximally efficient.
On the date of publication, Josh Enomoto had a position in: APLD. All information and data in this article is solely for informational purposes. For more information please view the Barchart Disclosure Policy here.
/AI%20(artificial%20intelligence)/Ai%20chip%20by%20Quality%20Stock%20Arts%20via%20Shutterstock.jpg)

/A%20hand%20holding%20a%20phone%20with%20the%20Reddit%20logo_%20Mamun_Sheikh%20via%20Shutterstock_.jpg)
/Seagate%20sign%20on%20the%20building%20atits%20operational%20headquarters%20By%20JHVEPhoto.jpeg)
/Apple%20logo%20on%20store%20front%20by%20frantic00%20via%20iStock.jpg)