
- During the US government shutdown, the soybean futures market posted a strong rally driven by what looked to be buying from both commercial and noncommercial interests.
- On the noncommercial side, this led to a record large noncommercial long futures positing the week of November 18, oddly enough the week the US government reopened.
- Since then, the market has seen renewed selling from both sides (commercial and noncommercial), putting the market in a downtrend.
This past weekend, I stumbled across a discussion of if it was time to get bullish US soybeans again. On the nay side the point was made the market was free falling despite record crush and export shipment numbers for US soybean meal. On the yay side someone argued that Watson – funds, the noncommercial side – were likely done selling so now was the time to buy. To the latter point let me add: Train, meet pedestrian caught on tracks.
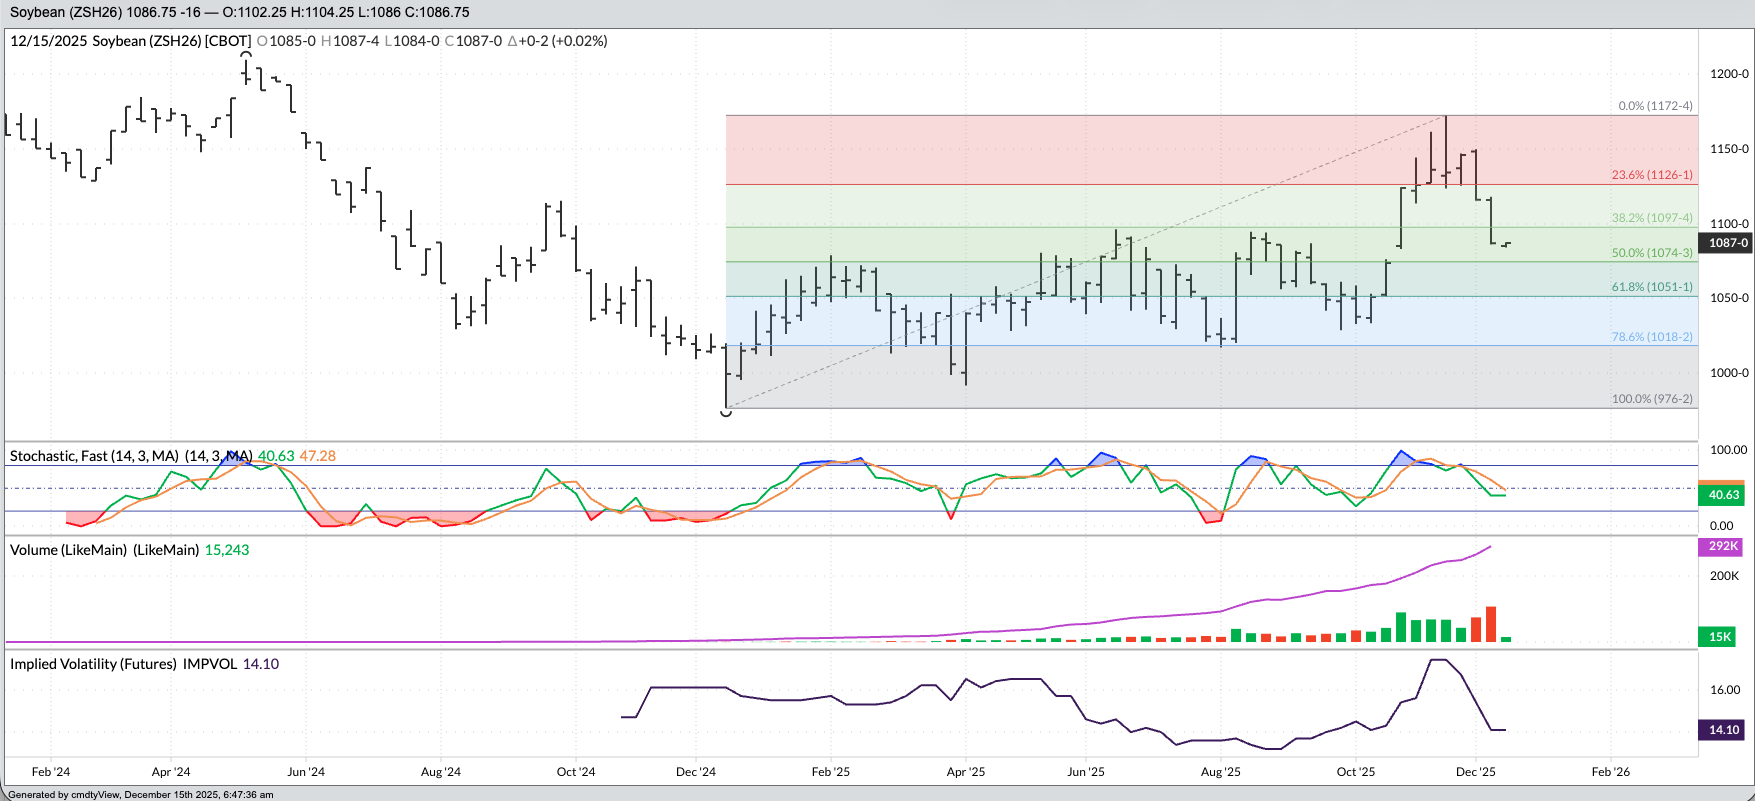
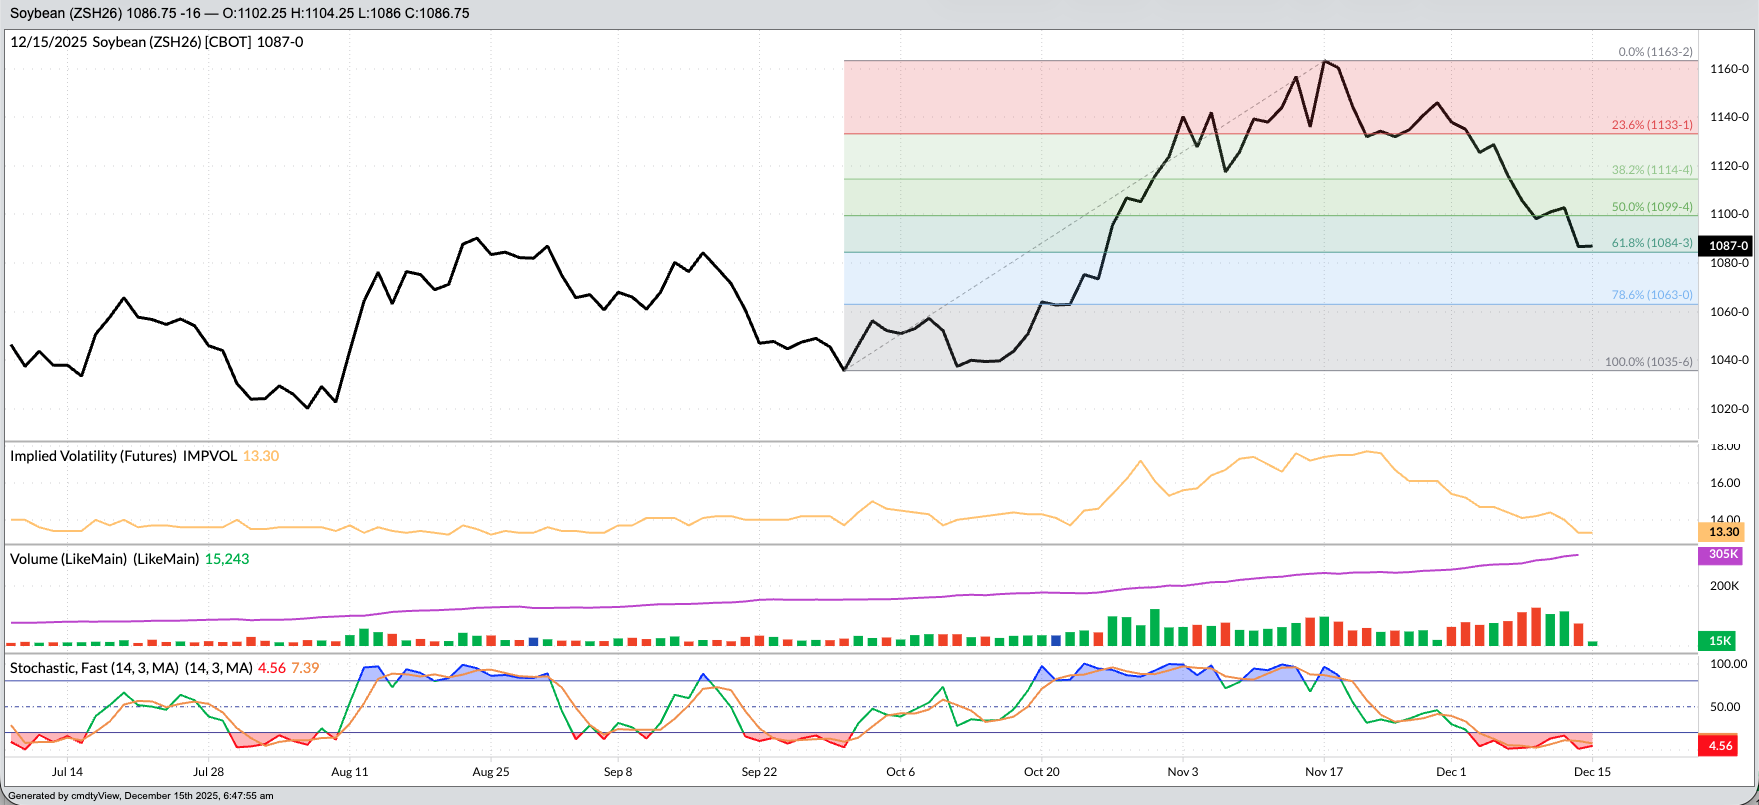
But what is the market telling us? Let’s start with basic technical analysis of trend, or price direction over time. A look at the weekly chart for the March soybean futures contract[i], the issue with the most open interest at this time, and we see a few interesting developments:
- Mar26 (ZSH26) posted a key bearish reversal the week of November 17. In other words, the contract extended the previous intermediate-term uptrend to a high of $11.7250 before taking out the previous week’s low of $11.2725 and closing Friday, November 21 at $11.3425, down 1.75 cents for the week. This reversal pattern confirmed a move to a new secondary downtrend, signaled the week before with a bearish crossover by weekly stochastics (momentum indicator) above the overbought level of 80%.
- The secondary downtrend gained momentum last week as Mar26 took out its previous 4-week low (another momentum indicator) of $11.1525 as it dropped to a low of $10.86 before closing Friday (December 12) at $10.8675, down 29.25 cents for the week.
- It’s interesting to note Mar26 then opened Sunday night (December 16) at $10.85, leaving a downside price gap that created a potential island top with the upside pride gap from the week of October 27, before rallying to a Monday morning high of $10.87.
The bottom line is the secondary (intermediate-term) trend has turned down. What does this tell us? If we apply Newton’s First Law of Motion to market analysis we have, “A trending market will stay in that trend, until acted upon by an outside force”. My addition to this has long been the outside force is a change in noncommercial (fund, Watson) activity. Therefore, when a market is trending up funds are buying; covering short futures, adding long futures, or possibly both. When a market is trending down funds are liquidating longs, adding shorts, or again, possibly both.
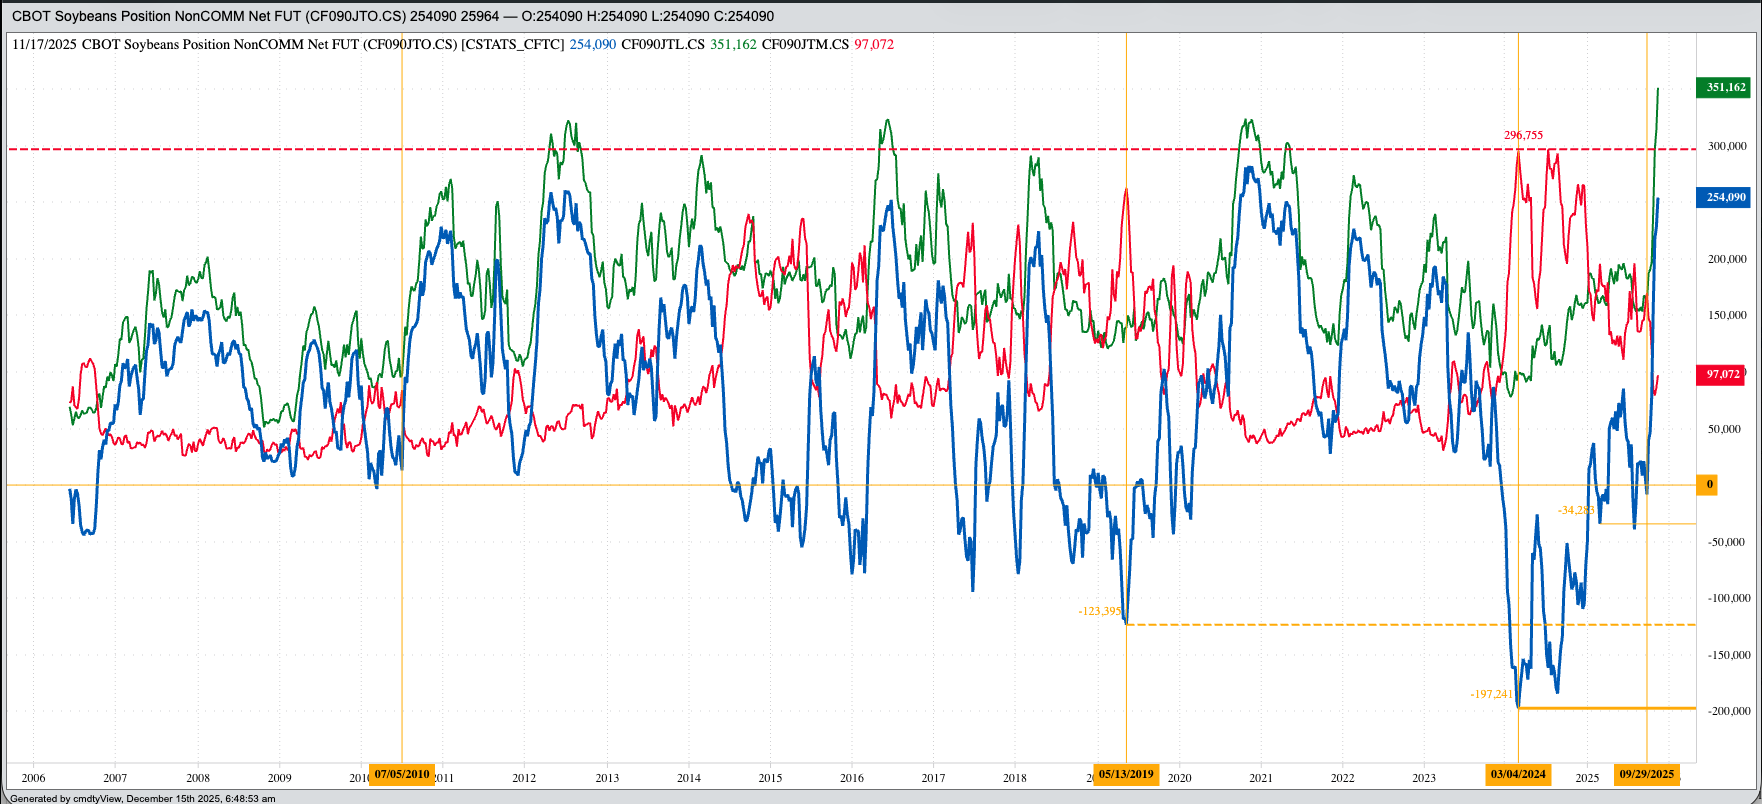
Last Friday’s CFTC Commitments of Traders report (legacy, futures only) showed noncommercial traders held a net-long futures position (blue line on chart) of 254,090 contracts, an increase of 25,964 contracts as of Tuesday, November 18.
- This included an increase in long futures of 36,750 contracts
- And an increase in short futures of 10,786 contracts
- The long futures position of 351,162 contracts (green line) was a new all-time record large
- Opening the door wider to a round of long liquidation over the weeks to come
Let’s look at some of the key dates on the noncommercial side:
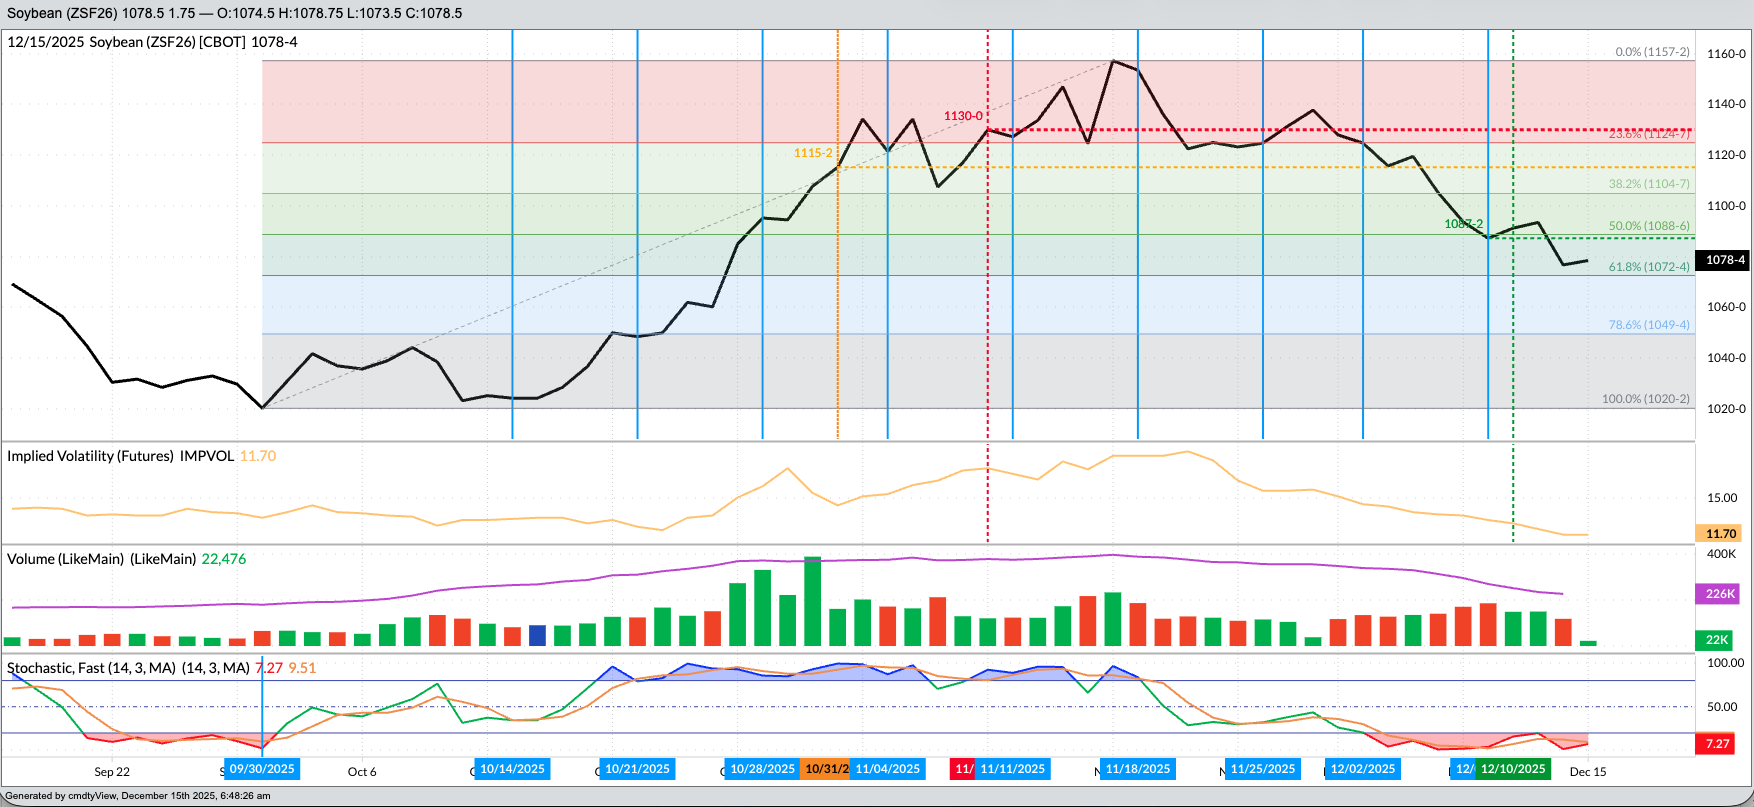
- The January futures contract (ZSF26) posted a low daily close of $10.2025 on September 30, the day before the US government shutdown.
- Jan26 then rallied to a high daily close of $11.5725 on November 17, with the US government opening the next day, November 18.
- Recall Mar26 posted a key bearish reversal on its weekly chart after posting its high of $11.7250 on November 17. Mar26 posted a low daily close of $10.3575 on September 30 and a high daily close of $11.6325 on November 17. Last Friday (December 12), Mar26 closed at $10.8675.
What about the two sides of the market? Noncommercial and Commercial?
- Funds moved from a net-short futures position of 8,333 contracts on Tuesday, September 30 to a net-long futures position of 254,090 contracts on Tuesday, November 18. A switch of 262,423 contracts during the exact time the US government was shut down.
- Recall the latest number includes a record large long futures position of 351,162 contracts.
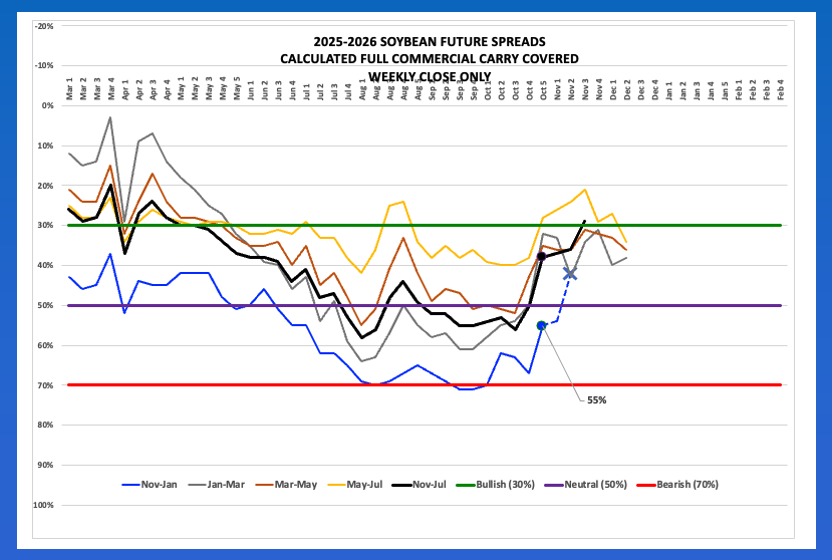
- Fundamentally, the Jan-March futures spread moved from covering 60% calculated full commercial carry on September 30 to 22% at the close of Monday, November 17 indicating there was likely some commercial support to the rally as well.
- The March-May spread moved from 50% to 23% during that same time frame, though has since moved back to 36% indicating renewed commercial selling tied to the outlook of Brazil’s 2026 production.
As for actual demand, the latest weekly export sales and shipments update, for the week ending Thursday, November 20, covered the time period when futures spreads indicated solid commercial demand. Total US shipments were reported at 10.812 million metric tons (397 mb) projecting a pace putting total marketing year shipments of 30.033 mmt (1.1 bb), down 40% from the previous marketing year’s reported shipments of 50.106 mmt (1.841 bb). At the same time, total sales (total shipments plus unshipped sales) were reported at 20.723 mmt (761 mb), down 38% from the same week the previous marketing year.
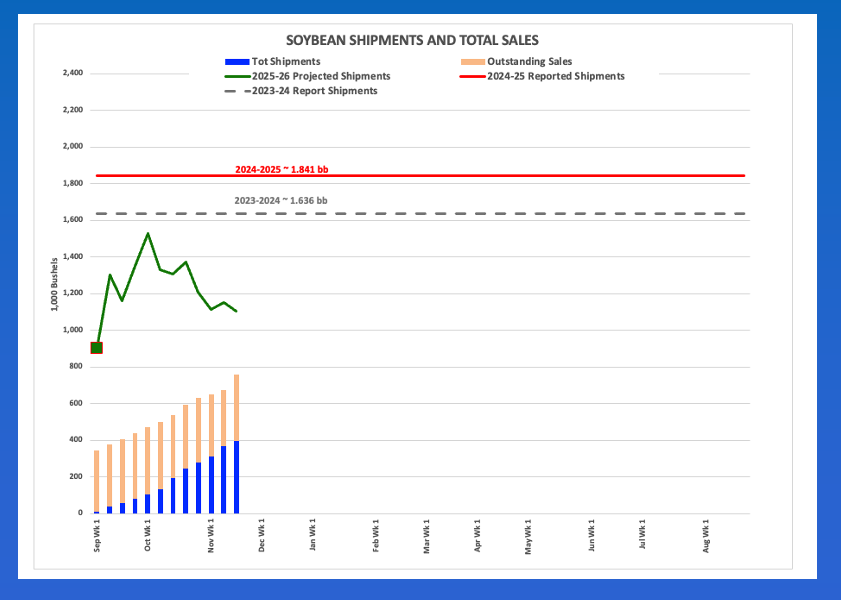
But was China buying? As of Thursday, November 20, China reportedly had 2.506 mmt (92 mb) on the books as compared to 4.319 mmt (159 mb) the same week the previous marketing year. It should be noted that on Thursday, October 2, as the US government was locked down, China had no US soybeans on the books for the 2025-2026 marketing year. Also at that time, the US was on pace to ship a total of 41.6 mmt (1.529 mb) meaning the pace projection decreased during the shutdown.
Is it time to buy soybeans? While the futures market could see a move to a short-term uptrend, the intermediate-term trend remains down. As Newsom’s Marketing Rule #1 tells us: Don’t get crossways with the trend. Why? Because, again, the trend of the futures market reflects noncommercial activity, and funds still look to be liquidating longs. Rule #6 tells us fundamentals win in the end, and fundamentally futures spreads are covering more calculated full commercial carry indicating pressure from the commercial side as well as the global market moves closer to Brazil’s next harvest.
[i] Based on the Goldilocks Principle: Daily charts are too hot, monthly charts are too cold, but weekly charts are just right.
On the date of publication, Darin Newsom did not have (either directly or indirectly) positions in any of the securities mentioned in this article. All information and data in this article is solely for informational purposes. For more information please view the Barchart Disclosure Policy here.

/Microsoft%20headquarters%20By%20Peter.jpeg)
/A%20close-up%20of%20the%20Broadcom%20logo%20on%20a%20smartphone%20by%20Timon%20via%20Adobe%20Stock.jpeg)
/Amazon%20-%20Image%20by%20bluestork%20via%20Shutterstock.jpg)
/Chipset%20held%20over%20rush%20hour%20traffic%20by%20Jae%20Young%20Ju%20via%20iStock.jpg)