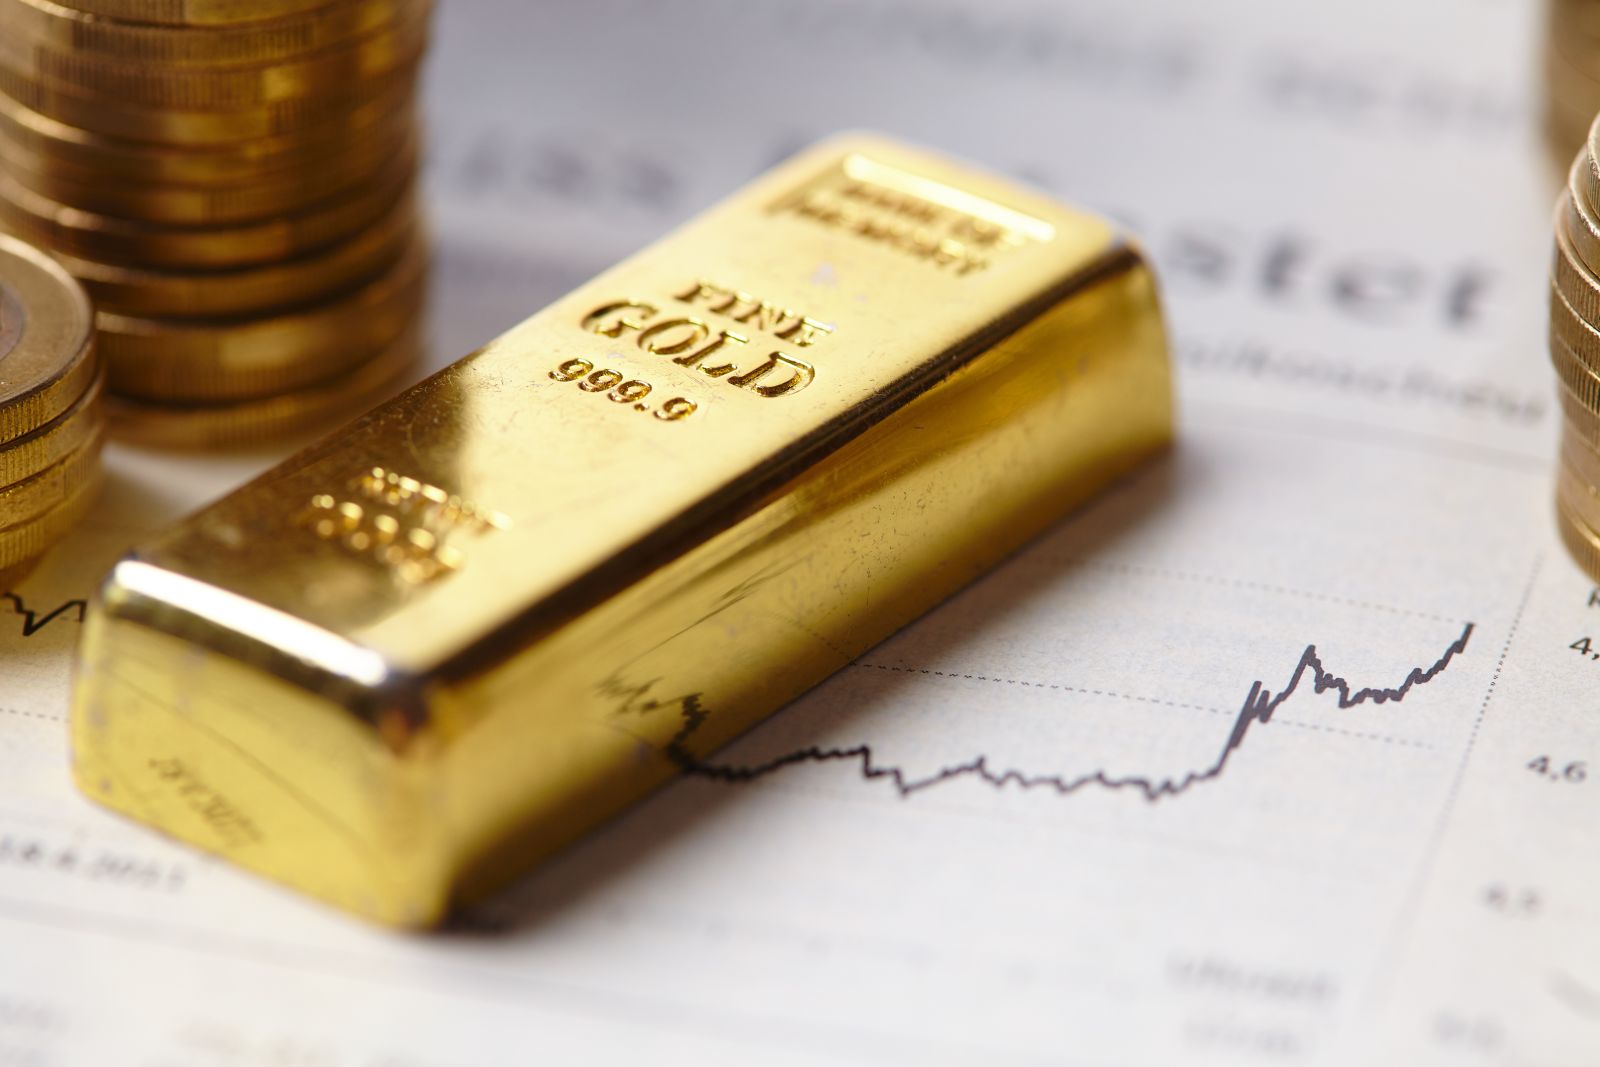
Gold prices have largely consolidated and traded sideways since late October 2025, driven by a combination of technical factors, a strong U.S. dollar, and easing safe-haven demand amid geopolitical developments.
A few key factors contributing to the stalling prices include:
- Profit-Taking and Overbought Conditions: Gold's price had experienced a historic rally throughout most of 2025, and the nearby continuous futures chart reached a record high of $4,398 per ounce in mid-October. Year-to-date, the February 2026 futures contract is up a whopping 51%. At the same time, the March silver futures are up an astonishing 88%! It's been a good year for investors, as both the equity market and diversification are making money in 2025. This significant run led to technically overbought market conditions, prompting investors to book profits, which naturally halted the upward momentum.
- A Stronger U.S. Dollar: The U.S. dollar rebounded and strengthened in October and November. The nearby continuous U.S. dollar futures chart has rallied almost 5% from that low. Because gold is priced in U.S. dollars, a stronger dollar makes the metal more expensive for foreign investors, which dampens international demand.
- Easing Geopolitical Tensions: Hopes for progress in U.S.-China trade talks and potential peace talks between the U.S., Russia, and Ukraine diminished gold's appeal as a safe-haven asset. As risk aversion in the broader market decreased, investors shifted focus away from gold.
- Uncertainty Over Federal Reserve Policy: While expectations of future Federal Reserve interest rate cuts initially fueled gold's rally, ongoing uncertainty and a lack of precise data (partially due to a U.S. government shutdown in late fall) have contributed to market indecisiveness. The CME Group's FedWatch tool has been volatile. One month ago, the market had priced in only a 67% chance of a 25-basis-point cut at the December meeting. Before that, the percentage was much higher. Today, there is an 88% chance of a 25-basis-point cut. The markets are obviously not liking the uncertainty of whether and when an interest rate change is coming. Higher real yields on other assets also make non-yielding gold less attractive.
- Seasonal Demand Shifts: The conclusion of the Diwali festival in India, a major global gold consumer, also contributed to a reduction in physical demand, removing one of the key supporting tailwinds for the price.
After all of this waiting, where does gold go from here?
Gold market analysts view this period of consolidation as a potential pause after a significant run, with future price movements heavily influenced by macroeconomic factors such as inflation, the trajectory of U.S. interest rates, and central bank purchases. While the gold market digests all this information, a few other factors are impacting the future of gold prices.
Technical Picture
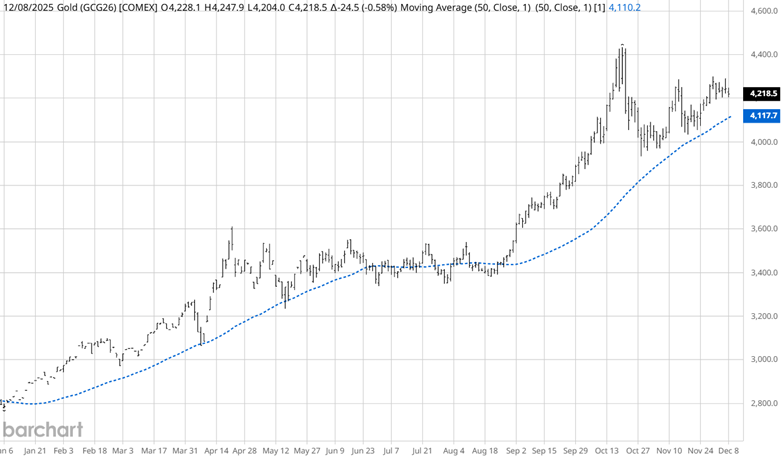
Source: Barchart
The year-to-date chart of the February gold contract shows that the upsloping 50-day simple moving average (SMA) has supported the uptrend all year. The gold market has many analysts wondering whether it will trade like the stock market and keep rising despite being overbought on many metrics.
Multi-Year Market Correlation
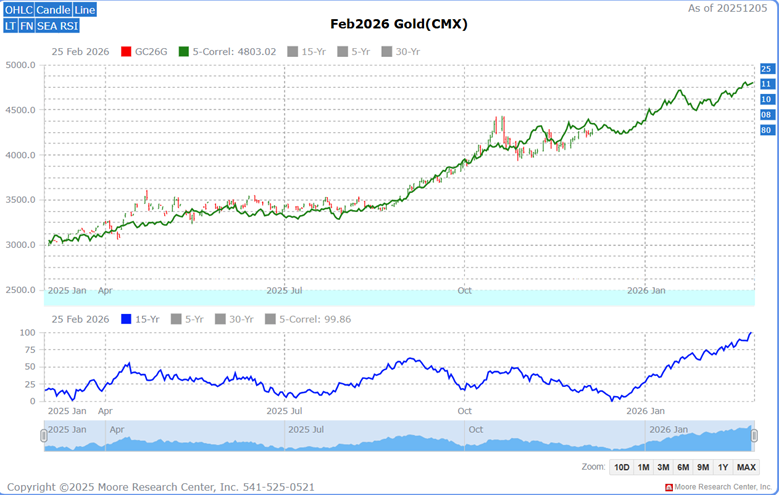
Source: Moore Research Center, Inc. (MRCI)
Correlation: 1980:93%, 2008:87%, 2010:88%, 2011:94%, and 2025:89%
MRCI research has found that the gold market is correlated to 5 years of past market activity. During those years, gold has traded sideways to lower into the latter part of December before the next significant move occurs.
The 15-year seasonal pattern (blue) confirms this move. We'll review the enhanced optimal seasonal window next.
Seasonal Pattern
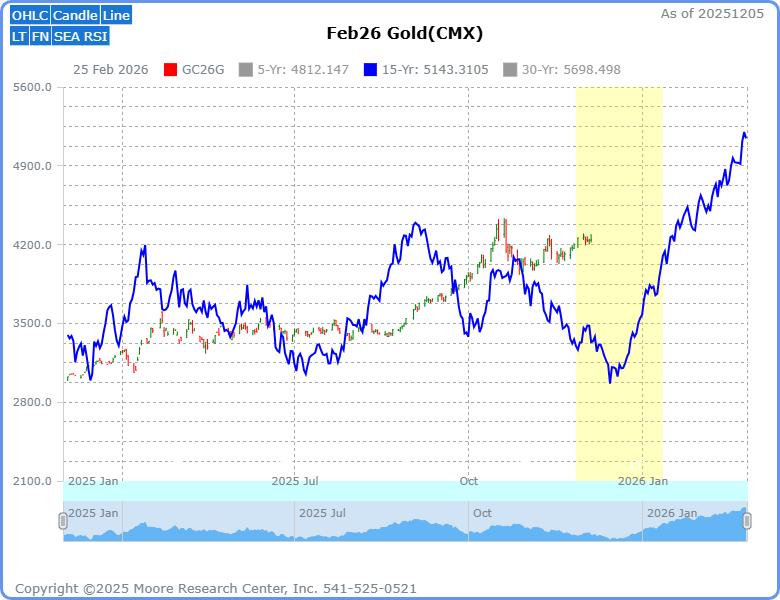
Source: MRCI
In October, I wrote an article for Barchart titled "Post-Diwali Demand Drop: How Fundamentals Shape Gold's 2025 Outlook." We discussed the significance of declining demand in the gold market, but a powerful seasonal buying period was not far away. You will also find the details of this optimal seasonal window setup.
The optimal seasonal buy window (yellow) opened on November 27 and will close near January 12. The article mentioned that traders may want to wait for a correction before entering this seasonal trade. MRCI research has found that the period in the latter part of December has been a more significant low, but there were also years when the market rallied from the latter part of November. These are the situations in which using other technical and fundamental factors, beyond just the seasonal pattern, is supportive to traders. Traders using these additional resources may have been informed that this year, the gold market was not ready to rally in November, but perhaps watching the gold market closely would yield an entry near the latter part of December.
As a crucial reminder, while seasonal patterns can provide valuable insights, they should not be the basis for trading decisions. Traders must consider various technical and fundamental indicators, risk management strategies, and market conditions to make informed and balanced trading decisions.
Assets to Participate in the Gold Market
In the past, futures traders could participate in these moves using the standard-size contract (GC) or the micro-size (GR) contract, and equity traders could use the exchange-traded fund (ETF) symbol (GLD). Additionally, investors could purchase physical gold in the spot market.
While the GR contract is more affordable than the GC for many traders, there has still been significant demand for a smaller gold contract from the retail trading base. To address this request, the CME Group launched a 1-ounce gold futures contract, GS, on January 13, 2025, aimed at the retail client.
Specifications for the new gold contract are:
- Contract Size: 1 ounce
- Pricing: U.S. dollars and cents per ounce
- Tick size: $0.25 (note the GC and GR contracts are $0.10)
- Trading symbol: 1OZ (Barchart symbol GS)
- Expiration months: Feb, Apr, Jun, Aug, Oct, & Dec
- Settlement method: Cash settled
The features of the 1OZ contract enable traders to track gold prices more accurately. The 1OZ futures are directly tied to the spot price, offering accurate market exposure.
In closing…
So here we are, two months into gold's significant pause after one of the wildest runs in history. Up 51% on the year, silver up nearly 90%, a stronger dollar, fading safe-haven vibes, post-Diwali quiet, and a Fed that can't make up its mind—everything lined up to put the brakes on the rally. The metal didn't crash! It just went sideways, catching its breath while everyone waits for the next real catalyst.
Looking ahead, the seasonal pattern that's worked pretty reliably over the past 15 years (and matched up eerily well in years like 2008, 2011, and now 2025) still points to a typical lull into late December, often followed by fresh strength in January. With the optimal buying window open until around January 12, plenty of traders are keeping powder dry for a better entry later this month. And for anyone who wants in without swinging the full 100-ounce contract, the new 1-ounce cash-settled GS futures make it easier than ever for retail players to ride whatever move comes next. After the year gold's had, nobody's counting it out just yet.
On the date of publication, Don Dawson did not have (either directly or indirectly) positions in any of the securities mentioned in this article. All information and data in this article is solely for informational purposes. For more information please view the Barchart Disclosure Policy here.

/An%20Intel%20sign%20out%20front%20of%20a%20corporate%20office%20by%20wolterke%20via%20Adobe%20Stock.jpeg)
/Alibaba%20by%20testing%20via%20Shutterstock.jpg)
/Alphabet%20(Google)%20Image%20by%20Markus%20Mainka%20via%20Shutterstock.jpg)