
By Brett Friedman, Winhall Risk Analytics/OptionMetrics Contributor
Aggressive bull markets often lead to speculation about whether they are overvalued or fundamentally unsound and therefore susceptible to a sudden and extreme end. The current AI-powered bull market, which has been in place since ChatGPT blew on to the scene in March 2023, seems to defy the naysayers at every turn. Each new high brings a fresh crop of doubts and warnings of an impending, and possibly violent, sell-off. Much to the chagrin of the perennially bearish, and except for some relatively brief periods, the bull market has continued largely unabated. With that in mind, let’s review the historical record of some of the metrics and arguments that many bears are using to support their opinion.
First, many point out that the bull market has been dominated by just a few AI-related names but lacks the breadth that is characteristic of sustainable overall returns. For example, Nvidia alone contributed more than 20% of the S&P 500’s return in 2024 and 2025. When combined with the other members of the Magnificent Seven, they now comprise approximately 37% of the S&P 500’s total market capitalization. If we look at the spread between the traditional, capitalization-weighted version (SPY) versus one with equal weight (Invesco S&P 500 Equal Weight ETF (RSP), this becomes clear:
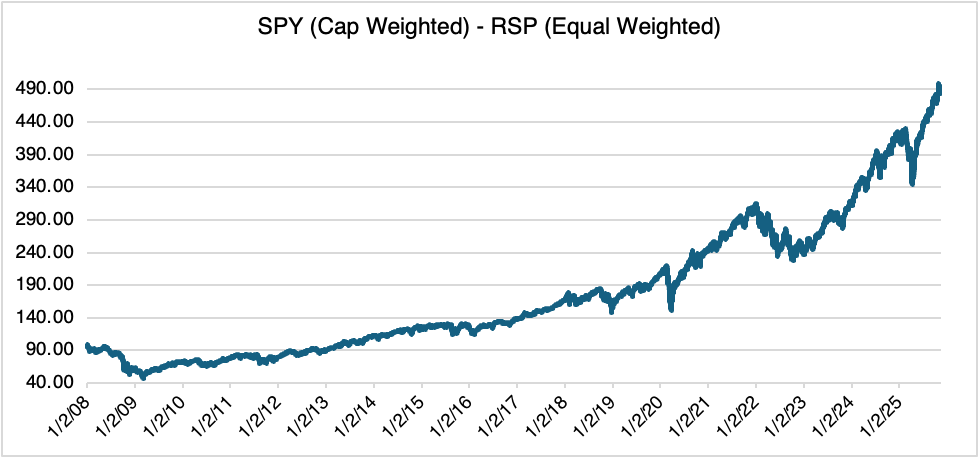
Source: OptionMetrics
However, notice that this trend has been in place since the height of the pandemic in March 2020, over 5½ years ago, and has been steepening since the initial tariff scare on April 7. Since then, the spread has gone on to make 26 new highs; at the same time, SPY has made 34 all-time highs, 8 in October alone. Judging from its record since 2000, the spread hasn’t been of much help in predicting an impending market top. It shows that concentration is increasing, but not if and when the trend will reverse.
Continuing with the overvaluation theme, many point out to market capitalizations as a percentage of GDP, the so-called “Buffett Indicator.” The theory goes that if the value of the market is growing faster than the economy, then it is overbought, and possibly even in a bubble.
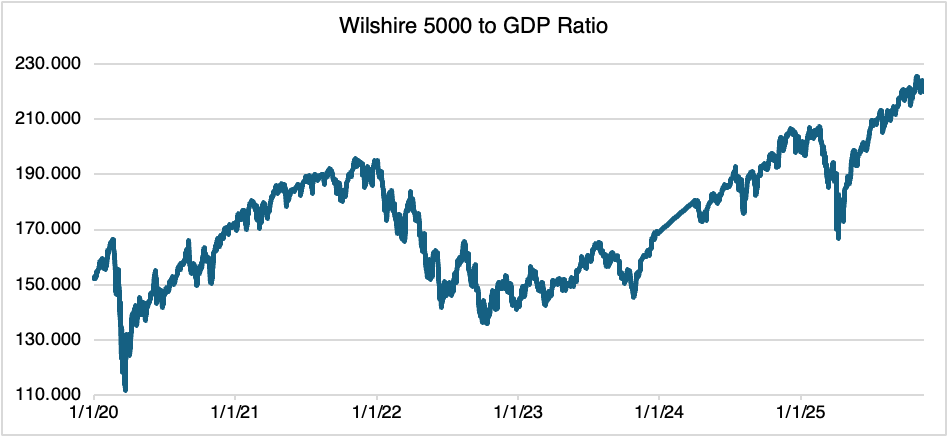
Source: buffettindicator.net
As you can see in the chart above, the ratio has been increasing since late 2023 and made new all-time highs last August. Since then, it has been rising to ever-higher levels. As a matter of common sense, certain market cap/GDP ratios are telling. For example, the current capitalization of Nvidia at $4.5 trillion (as of 11/19/2025) is larger than that of Japan; the MAG 7 total cap of approximately $22 trillion is larger than the total GDP of the European Union ($20 trillion). Again, it might show that the market is overvalued, and defies common sense, but does not indicate that the trend will reverse or when.
Economic policy uncertainty is also referenced as another valuation metric. The idea here is that higher uncertainty acts as a deterrent to investment. Using the index available on policyuncertainty.com, uncertainty has been volatile and elevated for most of 2025. Most recently, it increased rapidly due to renewed trade tensions with China (see chart below).

Source: policyuncertainty.com
However, absent extreme levels or jumps, and similar to the other indicators we have reviewed, rising uncertainty does not seem to have prevented the S&P from achieving new all-time highs.
Option pricing also provides some evidence of apparent overvaluation. Abhi Gupta of OptionMetrics constructed the following tail risk metric that measures the risk of potential crash risk exposure. Using OptionMetrics IvyDB US intraday data, the metric is derived by calculating the ratio of option prices to forward prices using 5-day, 0.30 delta options. Essentially, it tracks the relative pricing of out-of-the-money options, which can be viewed as the cost of insurance for downside protection. The chart below compares the tail risk factor for the top-10 S&P 500 constituents, which is dominated by AI and mega-cap tech companies, against the SPX index:
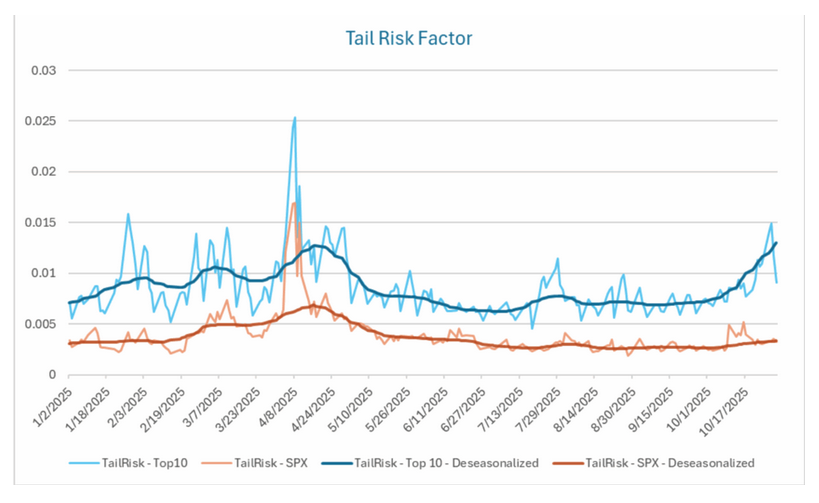
Source: OptionMetrics
As you can see, the tail risk factor for the top-10 diverged significantly in October, even when seasonally adjusted, implying higher prices for short-term downside protection and a greater probability of negative price action for the limited number of stocks currently driving the S&P higher.
Of course, bull markets and trends eventually fade, but the most important question is when, not if. Markets can remain overvalued for some time, confounding those continually searching for a top. Indeed, the indicators that we reviewed above have been leaning bearish, or flashing warning signs, for months or even years while the market has continued to make new highs. At best, they are indicating that the trend is overdone, or that a change may be impending. Although we can be certain that it will occur eventually, that is cold comfort for traders that have been facing consistent daily mark-to-market losses and dwindling performance. The battlefield is littered with those who have underestimated the market’s momentum and their ability to absorb losses. Contrarian investing can be hazardous business.
For more insights on equities, the options markets and volatility, visit the OptionMetrics blog.
There is an inherent risk involved with financial decisions. The information in this article is for informational purposes only and is not intended to provide financial advice. Views expressed are those of the author(s) and are not necessarily those of the company.

/AI%20(artificial%20intelligence)/AI%20engineer%20working%20on%20laptop%20by%20ART%20STOCK%20CREATIVE%20via%20Shutterstock.jpg)


/Nike%2C%20Inc_%20swish%20by-%20Tartezy%20via%20Shutterstock.jpg)