We sent out an update on Soybeans and Cattle last week and they have now hit their targets.
Soybeans
November
From last week,
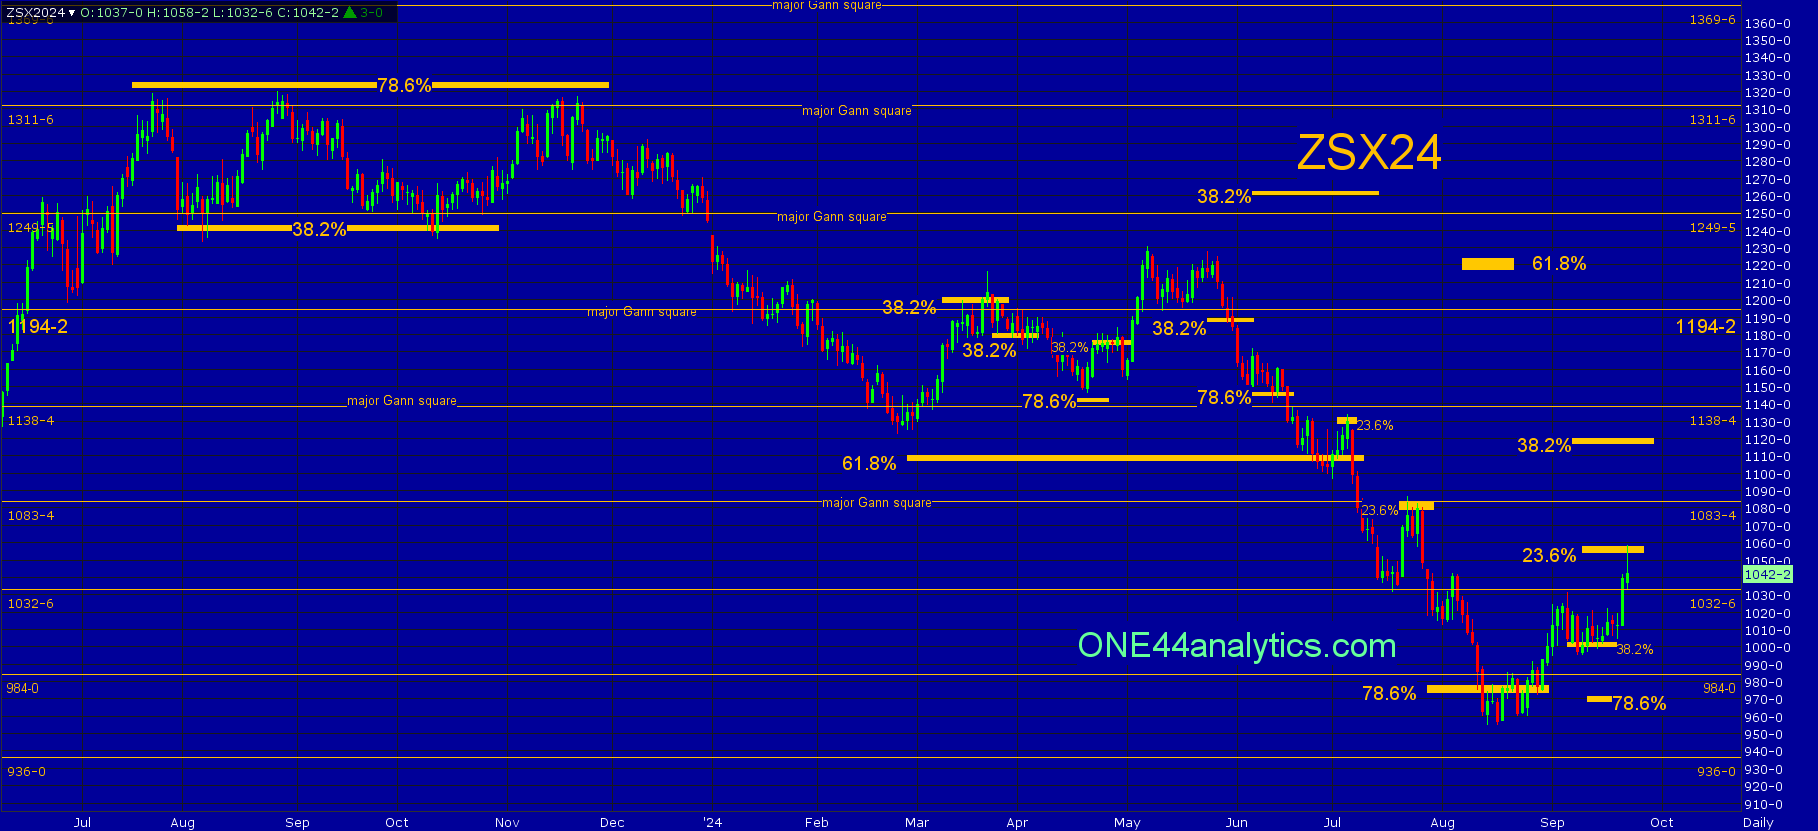
The small range for the week can be considered a positive thing since the setback from the 1032.75 major Gann square has not sent it down to the 78.6% level at 972.00 yet. The previous week had one close below 38.2% back to the low at 1002.00 and all of this week closed above it, another positive sign and this level will be key to the next week. We usually don't like to use the 38.2% retracement so early in a new leg, but holding as we said would be a good sign.
Use 1002.00 as the swing point for the week.
Above it, the short term target is 38.2% back to the contract high at 1116.00. The long term target is 61.8% at 1217.00. Any rally that can't get above 23.6% of the same move at 1055.00 is a very negative sign and new lows can quickly follow.
As you can see on the chart, it did hold 38.2% at 1002.00 and the rally from it hit 23.6% back to the 8/28/23 high at 1055.00. If all this market can rally is 23.6% it is not a good sign and new lows can quickly follow, based on the ONE44 23.6% rule.
Use 1055.00 as the swing point for now.
Soybean Oil
December
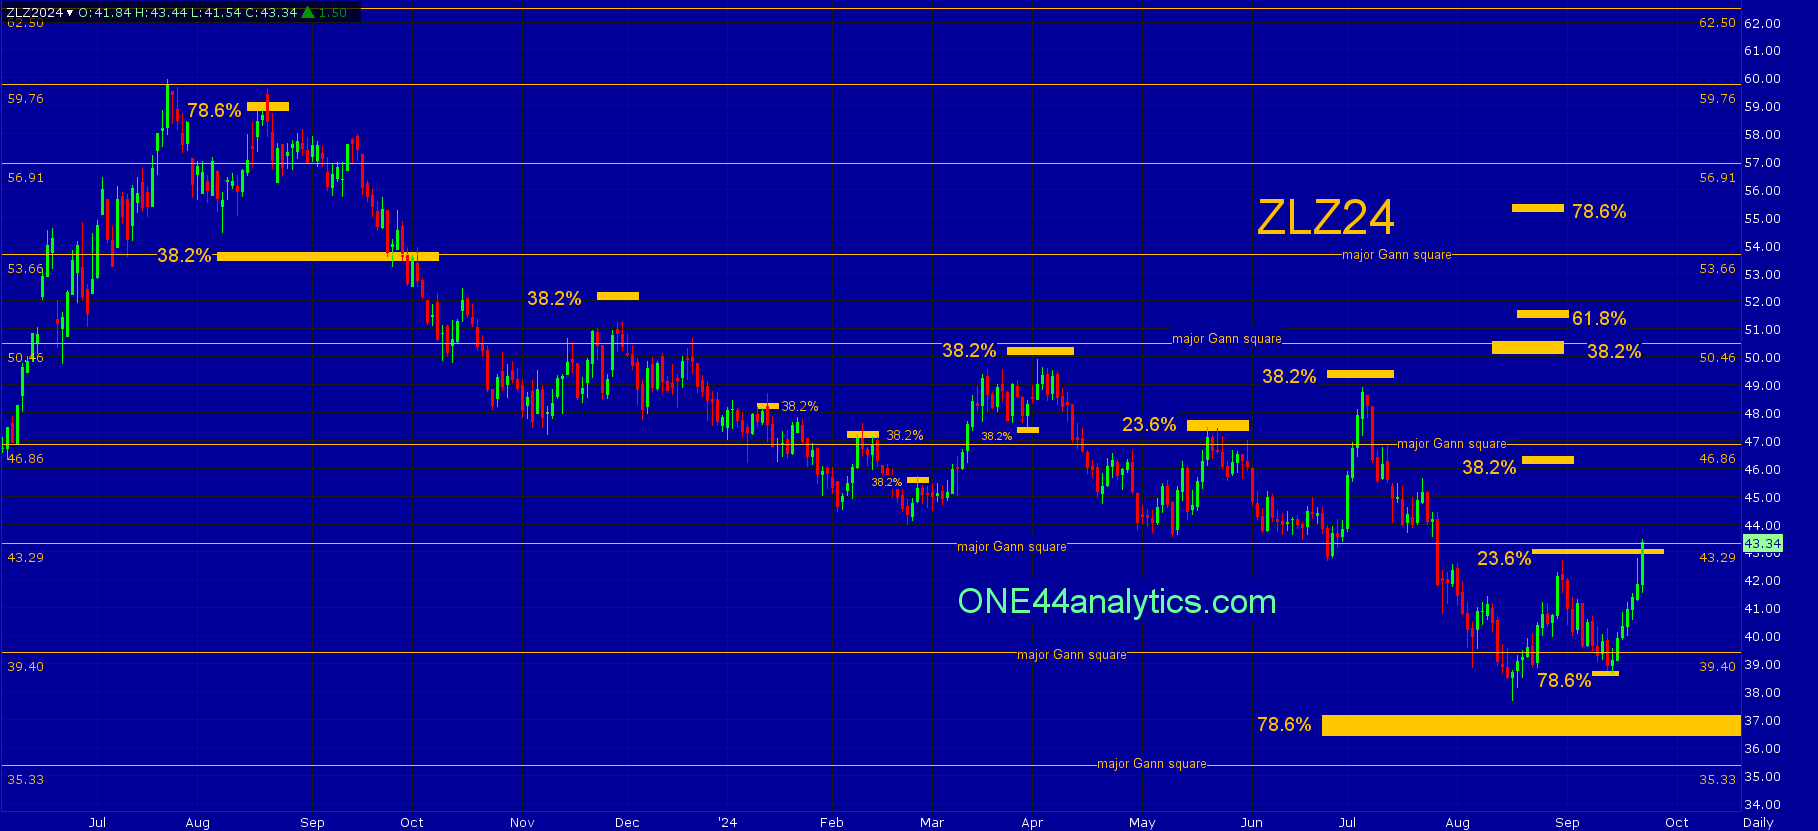
For those of you who have watched our latest video on how to use the Fibonacci retracements with the ONE44 rules and guidelines you know what started the current rally, “A failure to make a new low at a 78.6% retracement", this was 38.70. It has now rallied over $4.00.
This was our last update on 9/19/24.
December
From last week,
The setback from the 43.29 (23.6% and a major Gann square) area is just short of 78.6% back to the 8/16/24 low at 38.70.
Use 38.70 as the swing point for the week.
Monday's low hit 78.6% at 38.70 and there has been a $2.00 rally so far, what makes this more important is that holding a 78.6% level can be the start of a new bull move based on the ONE44 78.6% rule.
Use 38.70 as the swing point for the week again.
Above it, holding this area can be the start of the next leg up and more. The short term target is 38.2% back to the 7/24/23 high at 46.20. The long term target is....
Below it, the short term target is the 78.6% level at 37.10, a failure to turn higher from this area will give us only major Gann squares to look for support and the use as the swing point when closed below, the next two are....
Live Cattle
October
From last week,
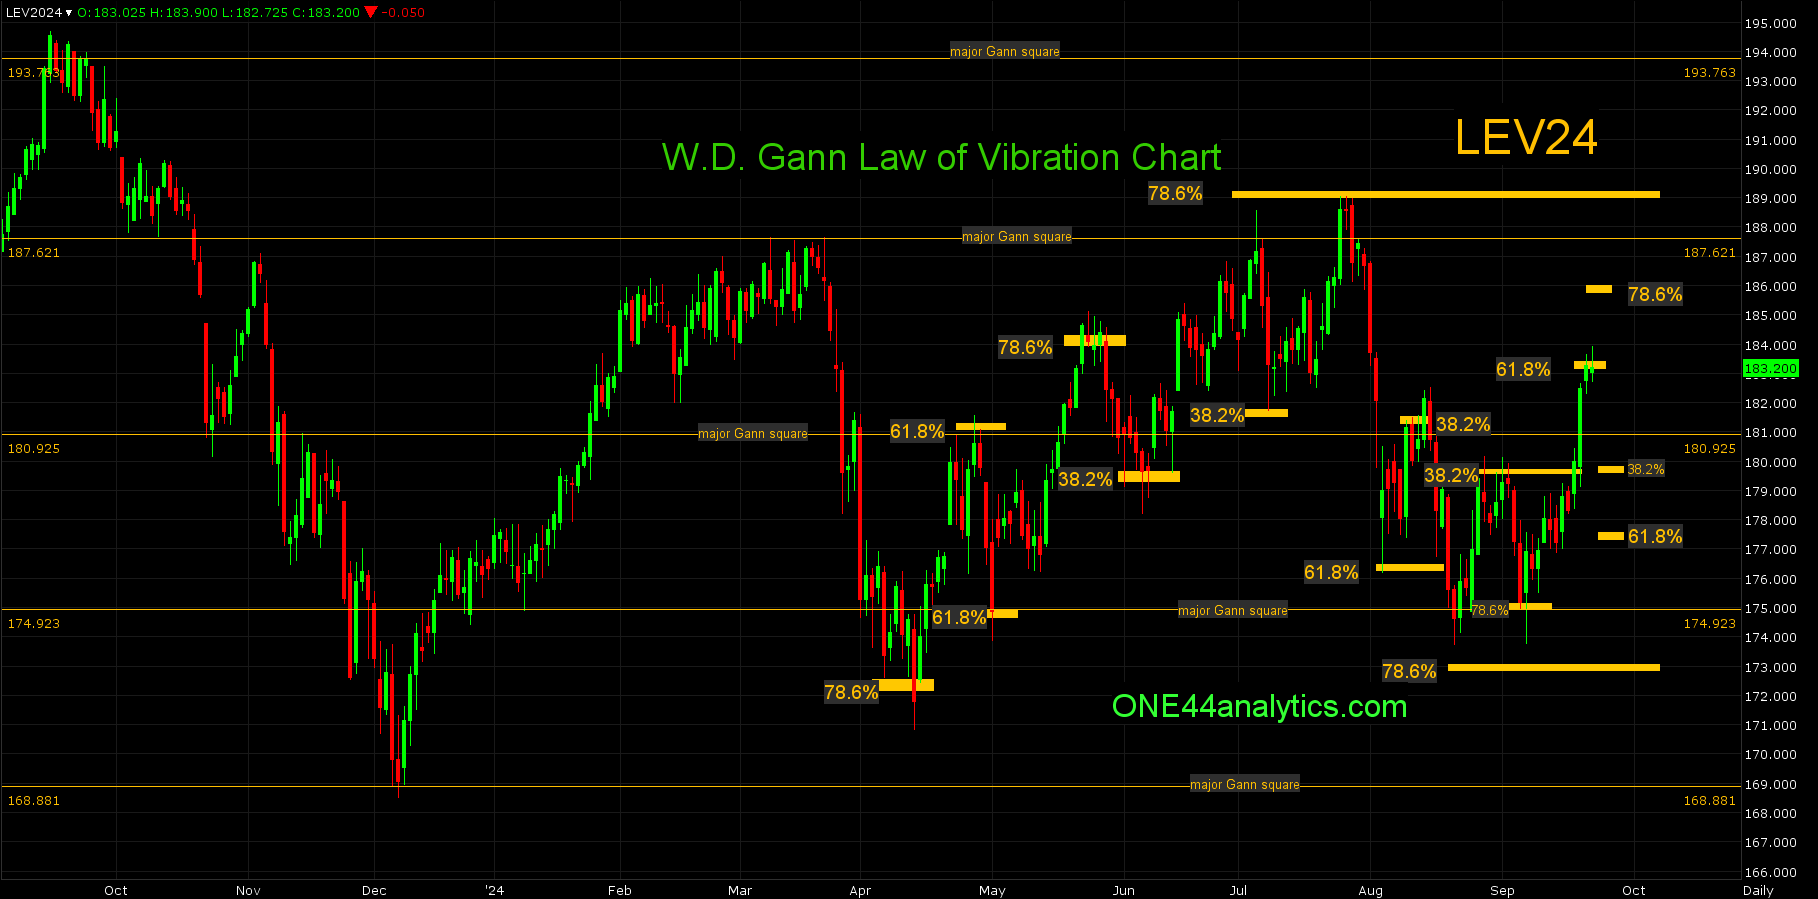
It was a quiet week and while not making a new low around the 78.6% retracement at 174.92 can be the base of the next bull move, it has been unable to get through 38.2% at 179.60 to turn the trend positive. All of the Above/Below levels remain the same for this week.
Use 179.60 as the swing point for the week again.
Above it, turns the short term trend positive and we will look for 61.8% of the same move at 183.20.
Today,
Now that the rally has hit the short term target of 183.20 at 61.8% we will use this as the swing point for the week now. The ONE44 61.8% rule will give us the downside target.
Use 183.20 as the swing point for the week.
Above it, look for 78.6% back to the 7/25/24 high at 185.80. On an extended move higher....
Below it, look for 61.8% the other way based on the ONE44 61.8% rule at 177.56. On an extended move lower, look for .....
ONE44 Analytics where the analysis is concise and to the point
Our goal is to not only give you actionable information, but to help you understand why we think this is happening based on pure price analysis with Fibonacci retracements, that we believe are the underlying structure of all markets and Gann squares.
If you like this type of analysis and trade the Grain/Livestock futures you can become a Premium Member.
You can also follow us on YouTube for more examples of how to use the Fibonacci retracements with the ONE44 rules and guidelines.
Sign up for our Free newsletter here.
FULL RISK DISCLOSURE: Futures trading contains substantial risk and is not for every investor. An investor could potentially lose all or more than the initial investment. Commission Rule 4.41(b)(1)(I) hypothetical or simulated performance results have certain inherent limitations. Unlike an actual performance record, simulated results do not represent actual trading. Also, since the trades have not actually been executed, the results may have under- or over-compensated for the impact, if any, of certain market factors, such as lack of liquidity. Simulated trading programs in general are also subject to the fact that they are designed with the benefit of hindsight. No representation is being made that any account will or is likely to achieve profits or losses similar to those shown. Past performance is not necessarily indicative of future results.
On the date of publication, Nick Ehrenberg did not have (either directly or indirectly) positions in any of the securities mentioned in this article. All information and data in this article is solely for informational purposes. For more information please view the Barchart Disclosure Policy here.
/Dell%20Technologies%20by%20Poetra_RH%20via%20Shutterstock.jpg)
/The%20sign%20for%20Marvell%20Technology%20out%20front%20of%20a%20corporate%20office%20by%20Valeriya%20Zankovych%20via%20Shutterstock.jpg)

/Intel%20Corp_%20badge%20holder-by%20hasrul_rais%20via%20Shutterstock.jpg)
