There are no holy grails in investing. There’s no strategy that is foolproof, that works 100% of the time. So when it comes to the markets, perfectionists need not apply.
However, there’s plenty of room for “great setups.”
I define a great setup as when I see something, regardless of time frame, which leads me to believe that the return potential dwarfs the risk.
So how do I find these setups? Lately, I’ve been using Barchart’s toolkit to up my trading game.
You see, I have not been a trader my whole life. But I’ve been an investor since the 1990s.
I only added trading to my approach a few years ago, after I sold my investment advisory practice. I now try to learn from my many mistakes, and Barchart matching my methodical process with its tools is frankly liberating.
My USO trade this week, and what it taught me
I review several hundred ETF, stock, and index charts every week. I even run through all the stocks in the S&P 500 Index ($SPX) a couple of times a month. In baseball, they call it a “twitch response” – hitters are trained to the point where they can decide in about a quarter of a second if they are going to swing at a pitch. To me, that’s Barchart’s Interactive Charts, about 15 years into using them (and their predecessor, the Snapshot Charts).
That’s why I “stopped my scroll” when I saw this. The most liquid ETF (USO) to play the price of oil (CLN26). I marked the rolling over of the 20-day and 50-day moving averages as well as the percentage price oscillator (PPO). And, the range of the PPO, which indicated to me that the bottom may be falling out, but rock bottom could be a ways down from here.
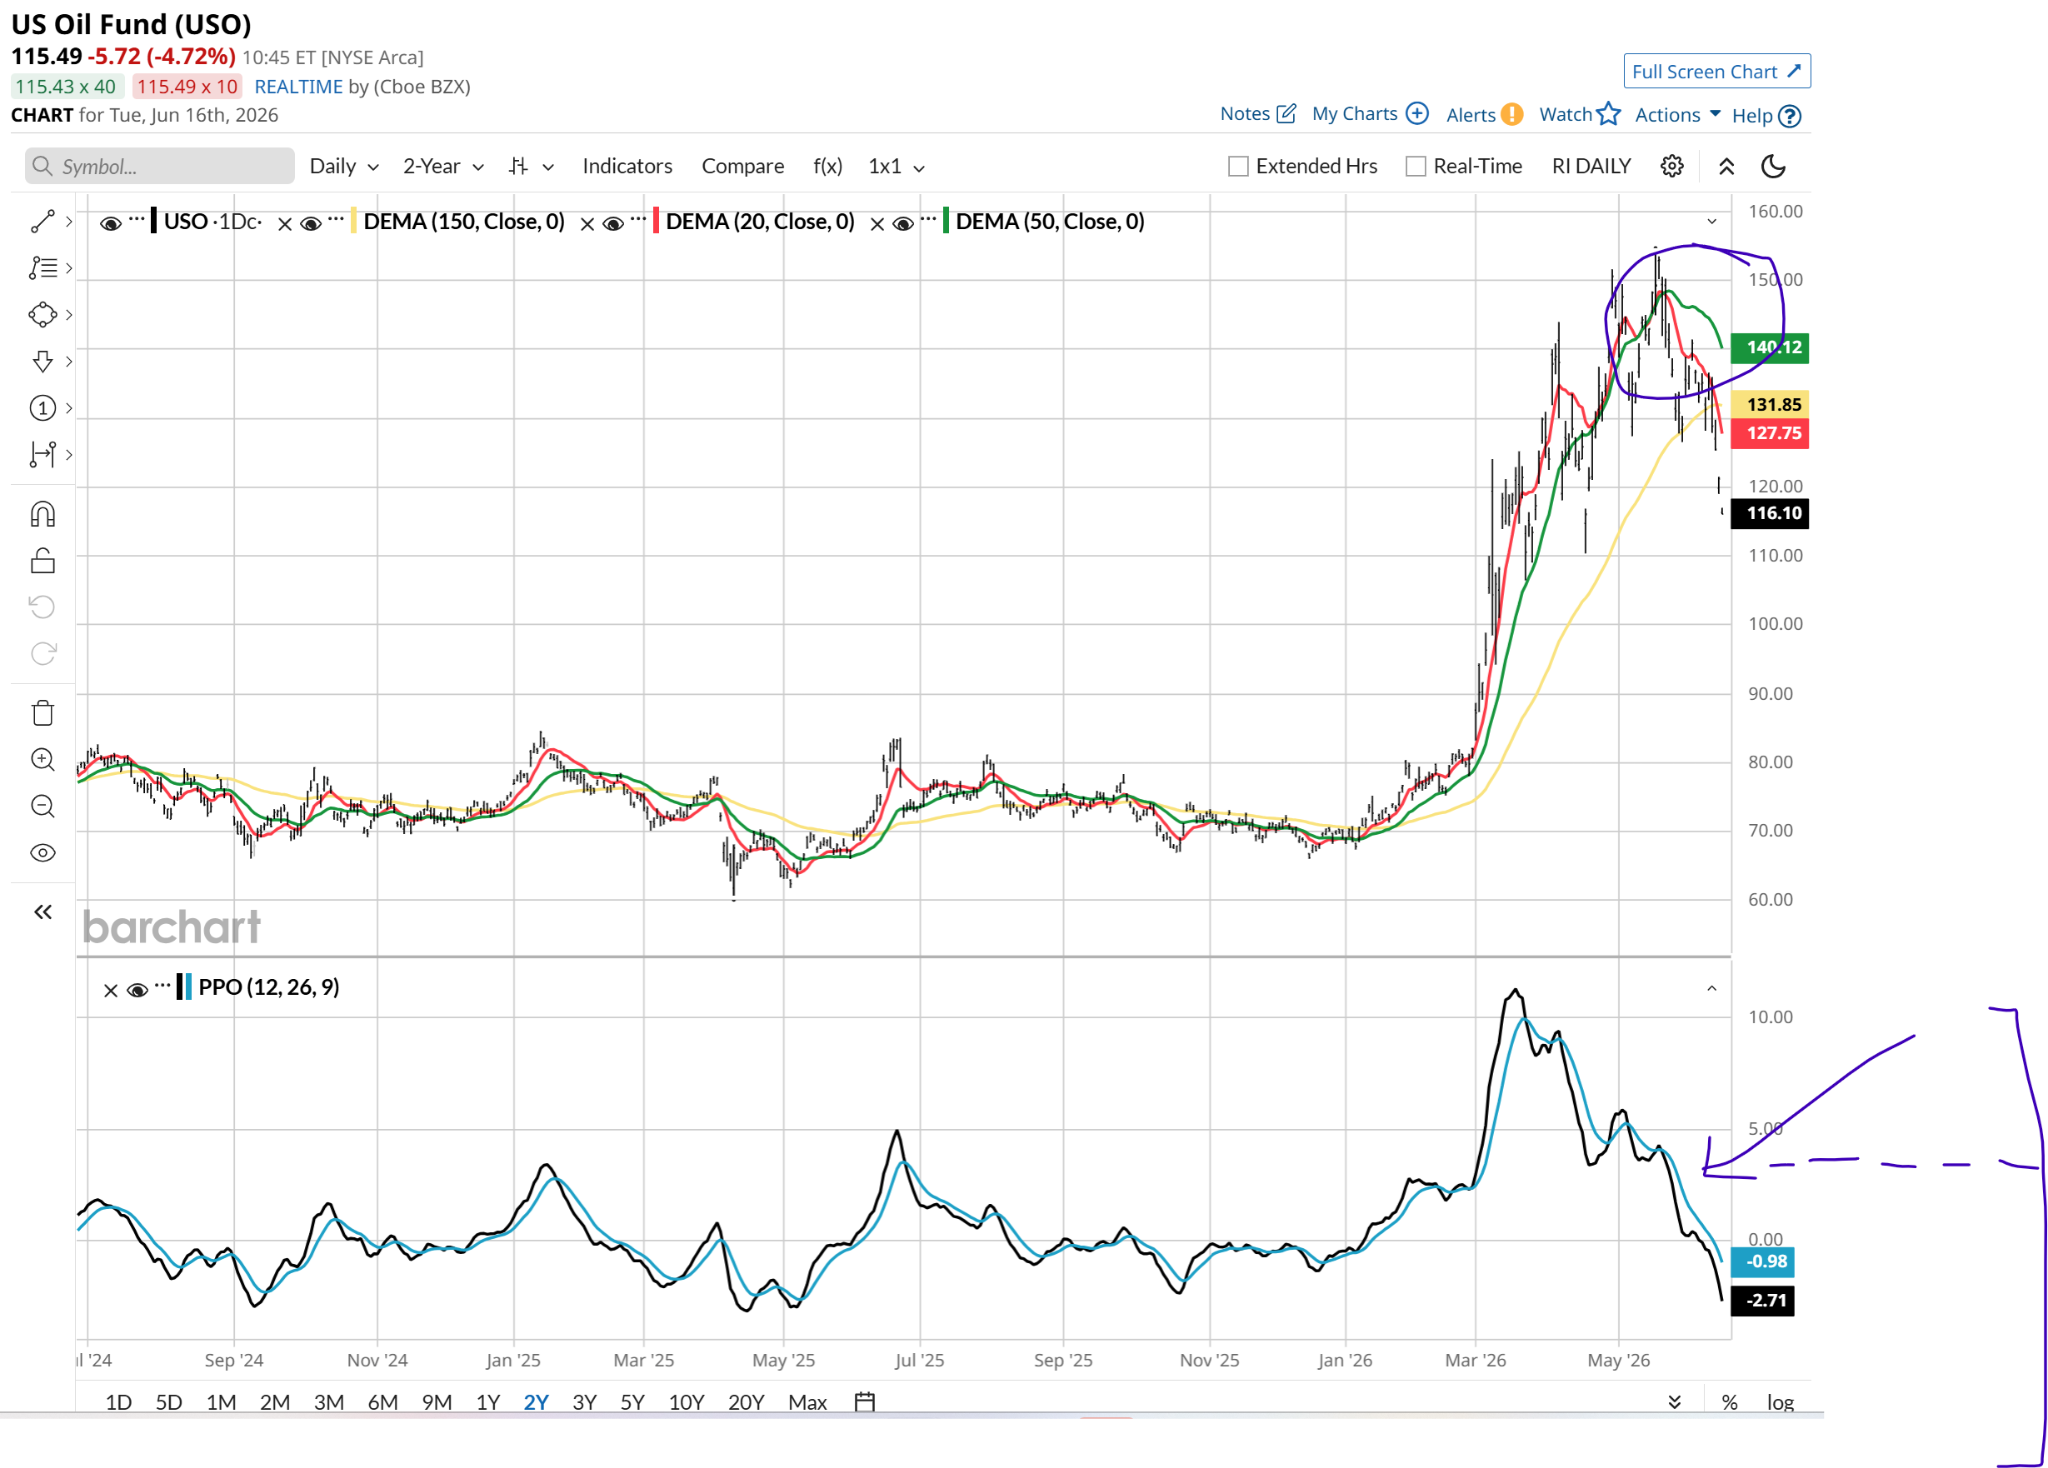
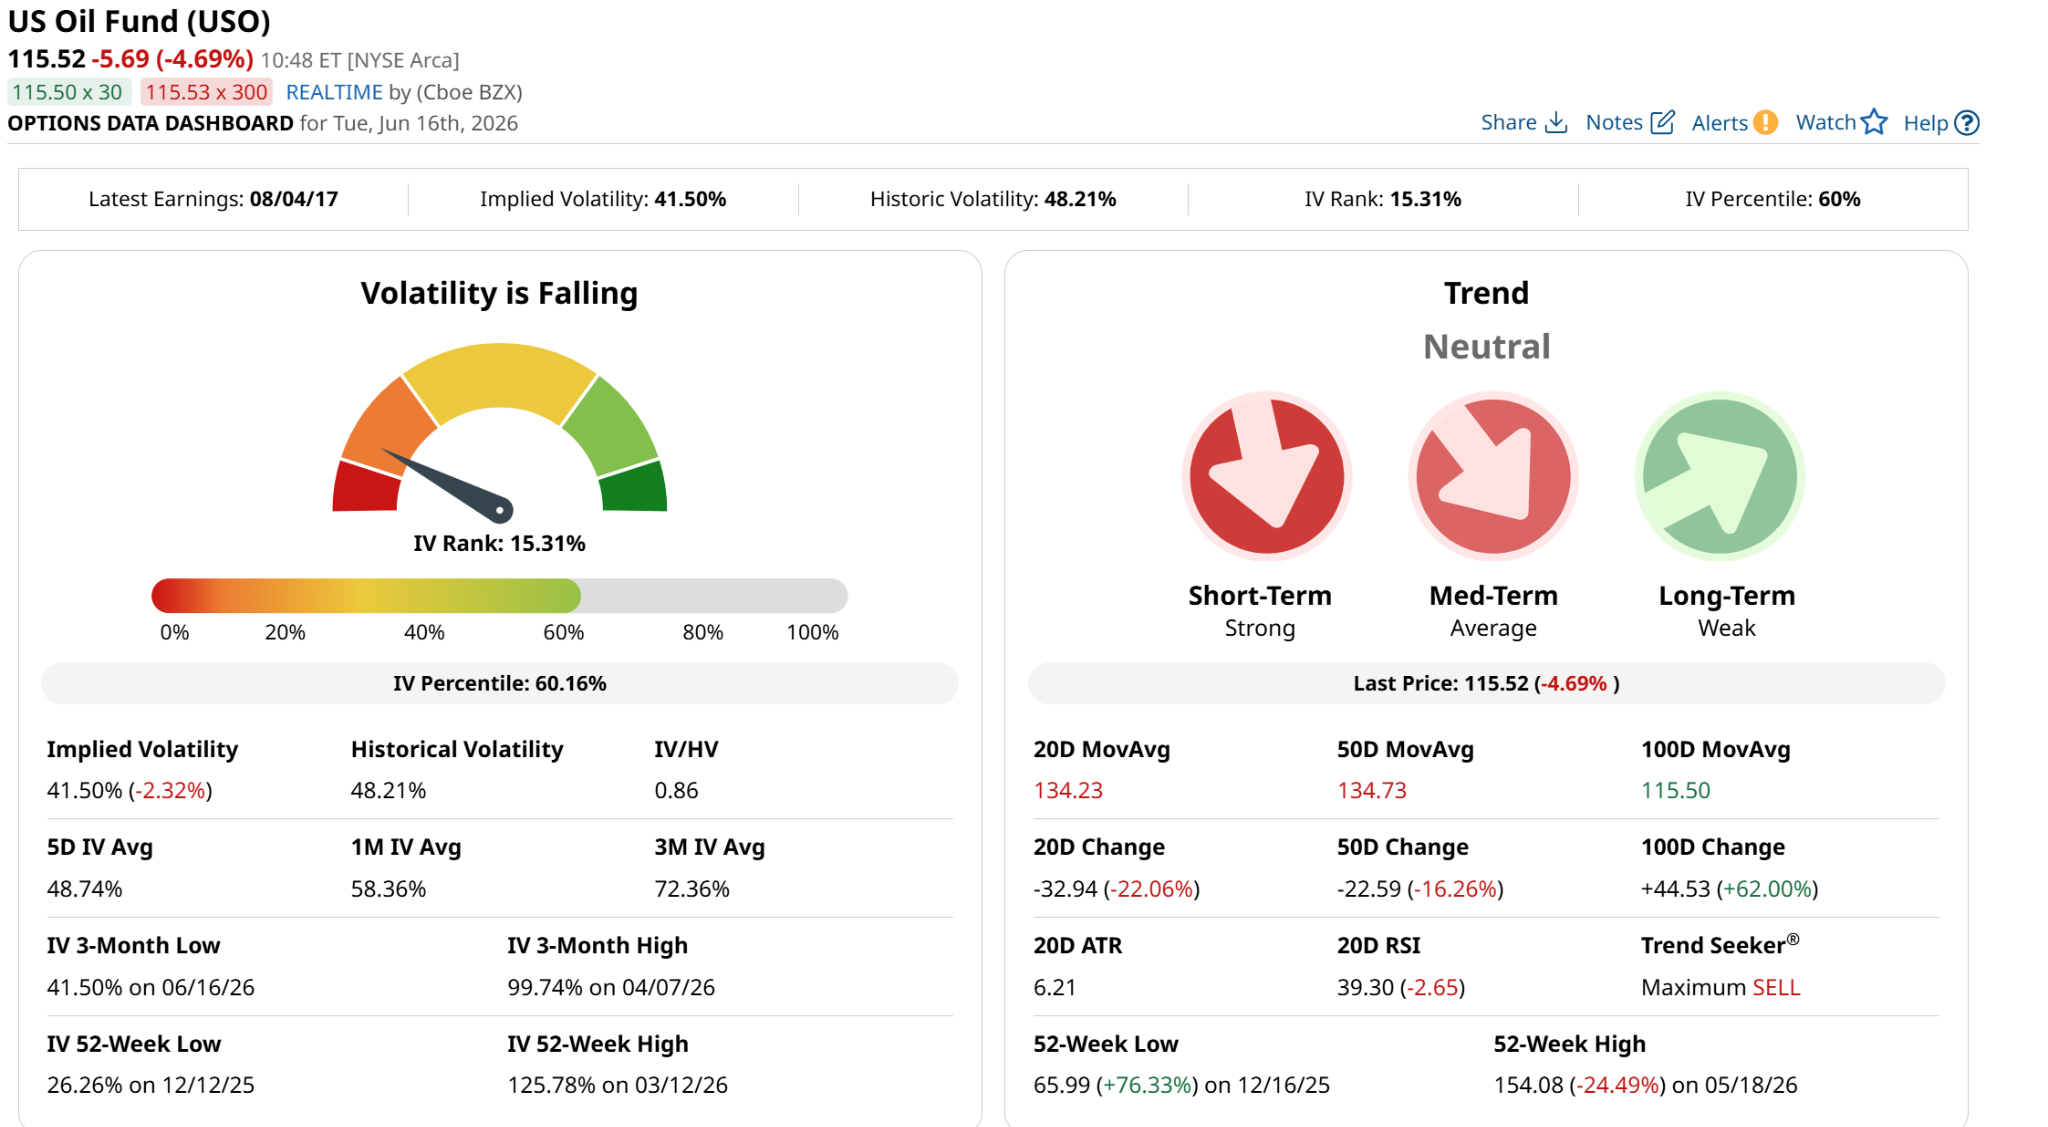
That chart of USO was the “tip of the oil-berg” if you will. Then, I remembered what I had seen in a recent scan of charts and option setups: that despite the Iran War, its volatility rank and IV percentile were still quite tame. Translation: “Convexity” or deep out-of-the-money puts might be worth a try.
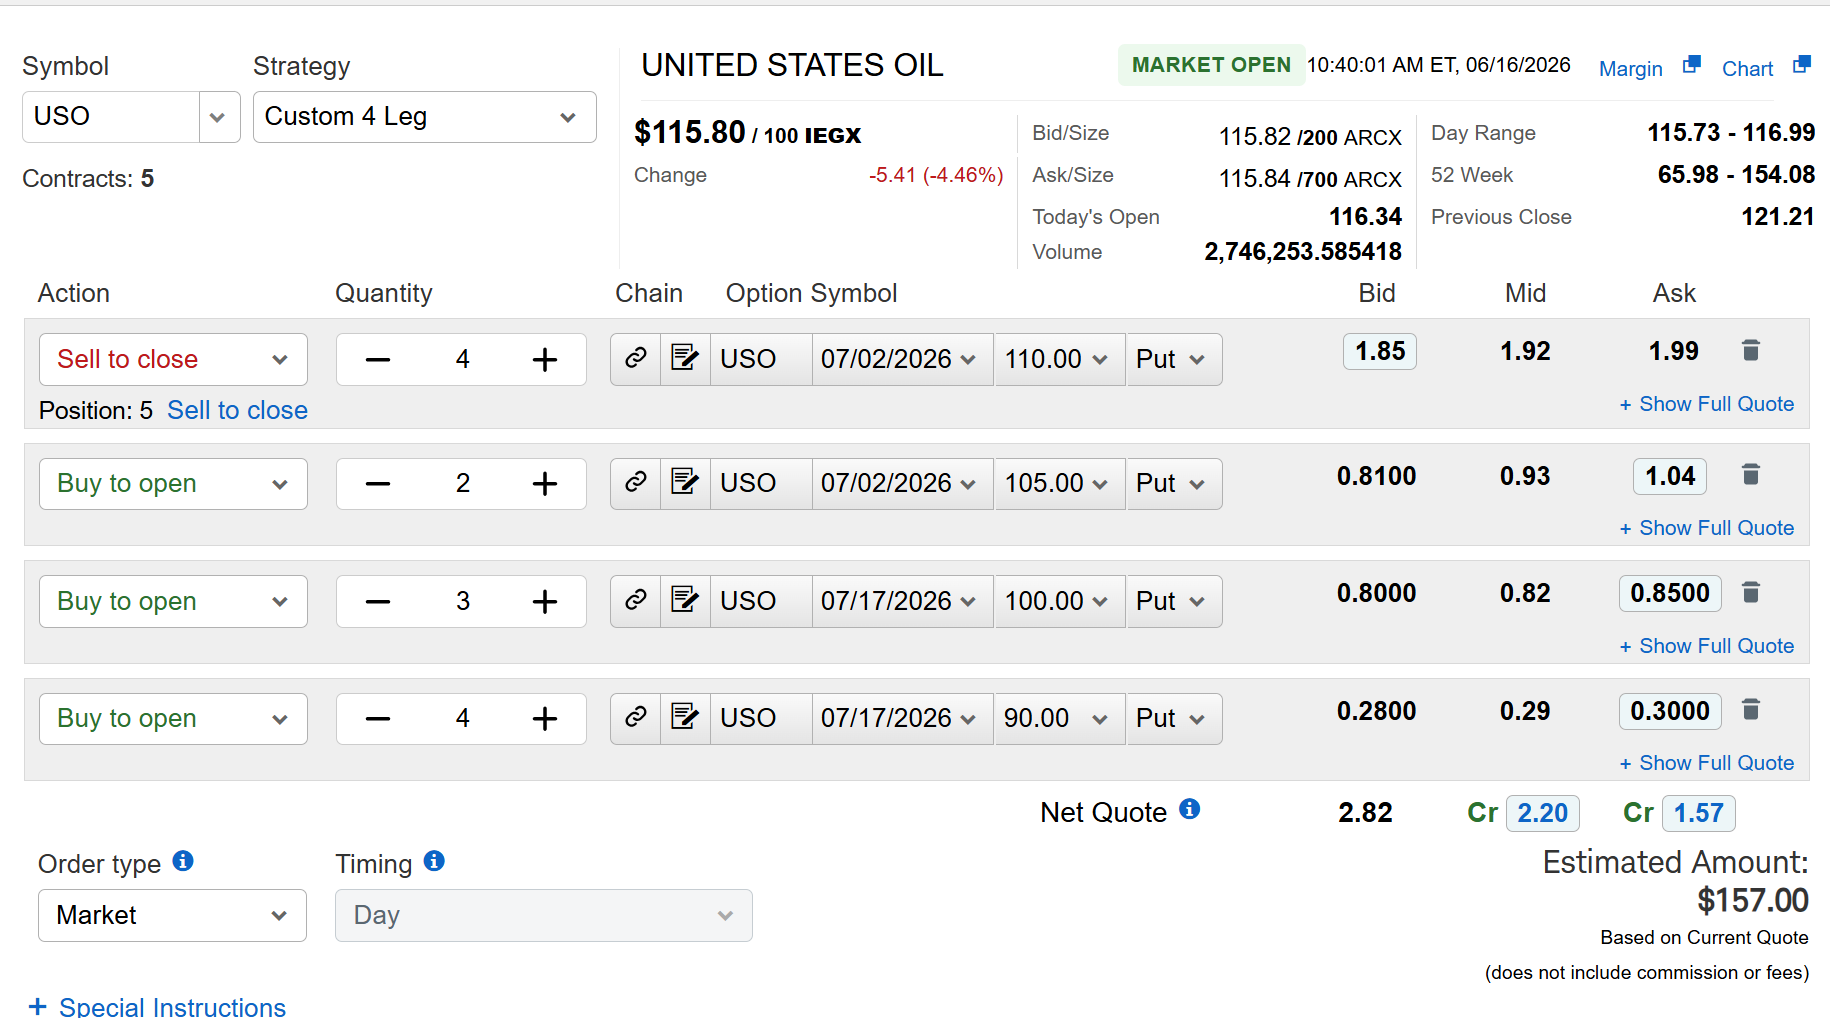
To be clear, this is an options trading account, and it’s one of my smaller accounts on purpose. Because with options, we control a lot of the stock or ETF we want to own or short, as in this case. But do so by putting up 100% of the capital we are willing to lose if it doesn’t go our way.

In my case, at least to start a position to profit from a decline in USO in the next several weeks, I decided that the worst-case scenario was about $600. As you can see here from my brokerage account, $583.31 was the exact amount I was willing to “burn” if USO did not get there in time, or if the price of oil went up over that initial time frame, from June 15 to July 2.
That allowed me to “control” about:
($116 share price of USO) x (5 contracts) x (100 options multiplier) = $58,000 worth of USO. With a maximum loss of less than $600.
This was how it started, with a single trade. But as I’ve learned, sometimes the best way to operate if you are a defensive trader like I am is to take your profits gradually.
This is a good example, not necessarily because of my gains. But because of how little I had to lose! And how Barchart.com’s data and preset page views made it super easy to navigate.
While it would not be very time-efficient for me to relate each step of what turned out to be a very useful adventure regarding my trading of USO, I think this screenshot will help.
Once USO got going to the downside, I was able to sell four of the five initial put option contracts at a nice one-day profit. No, they don’t all work that way! But the goal here is to show how you can turn that return/risk ratio sharply in your favor. That’s the goal of my trading AND my investing. And what led to my creation of the ROAR Score, my proprietary technical analysis system and an automated chart reader.
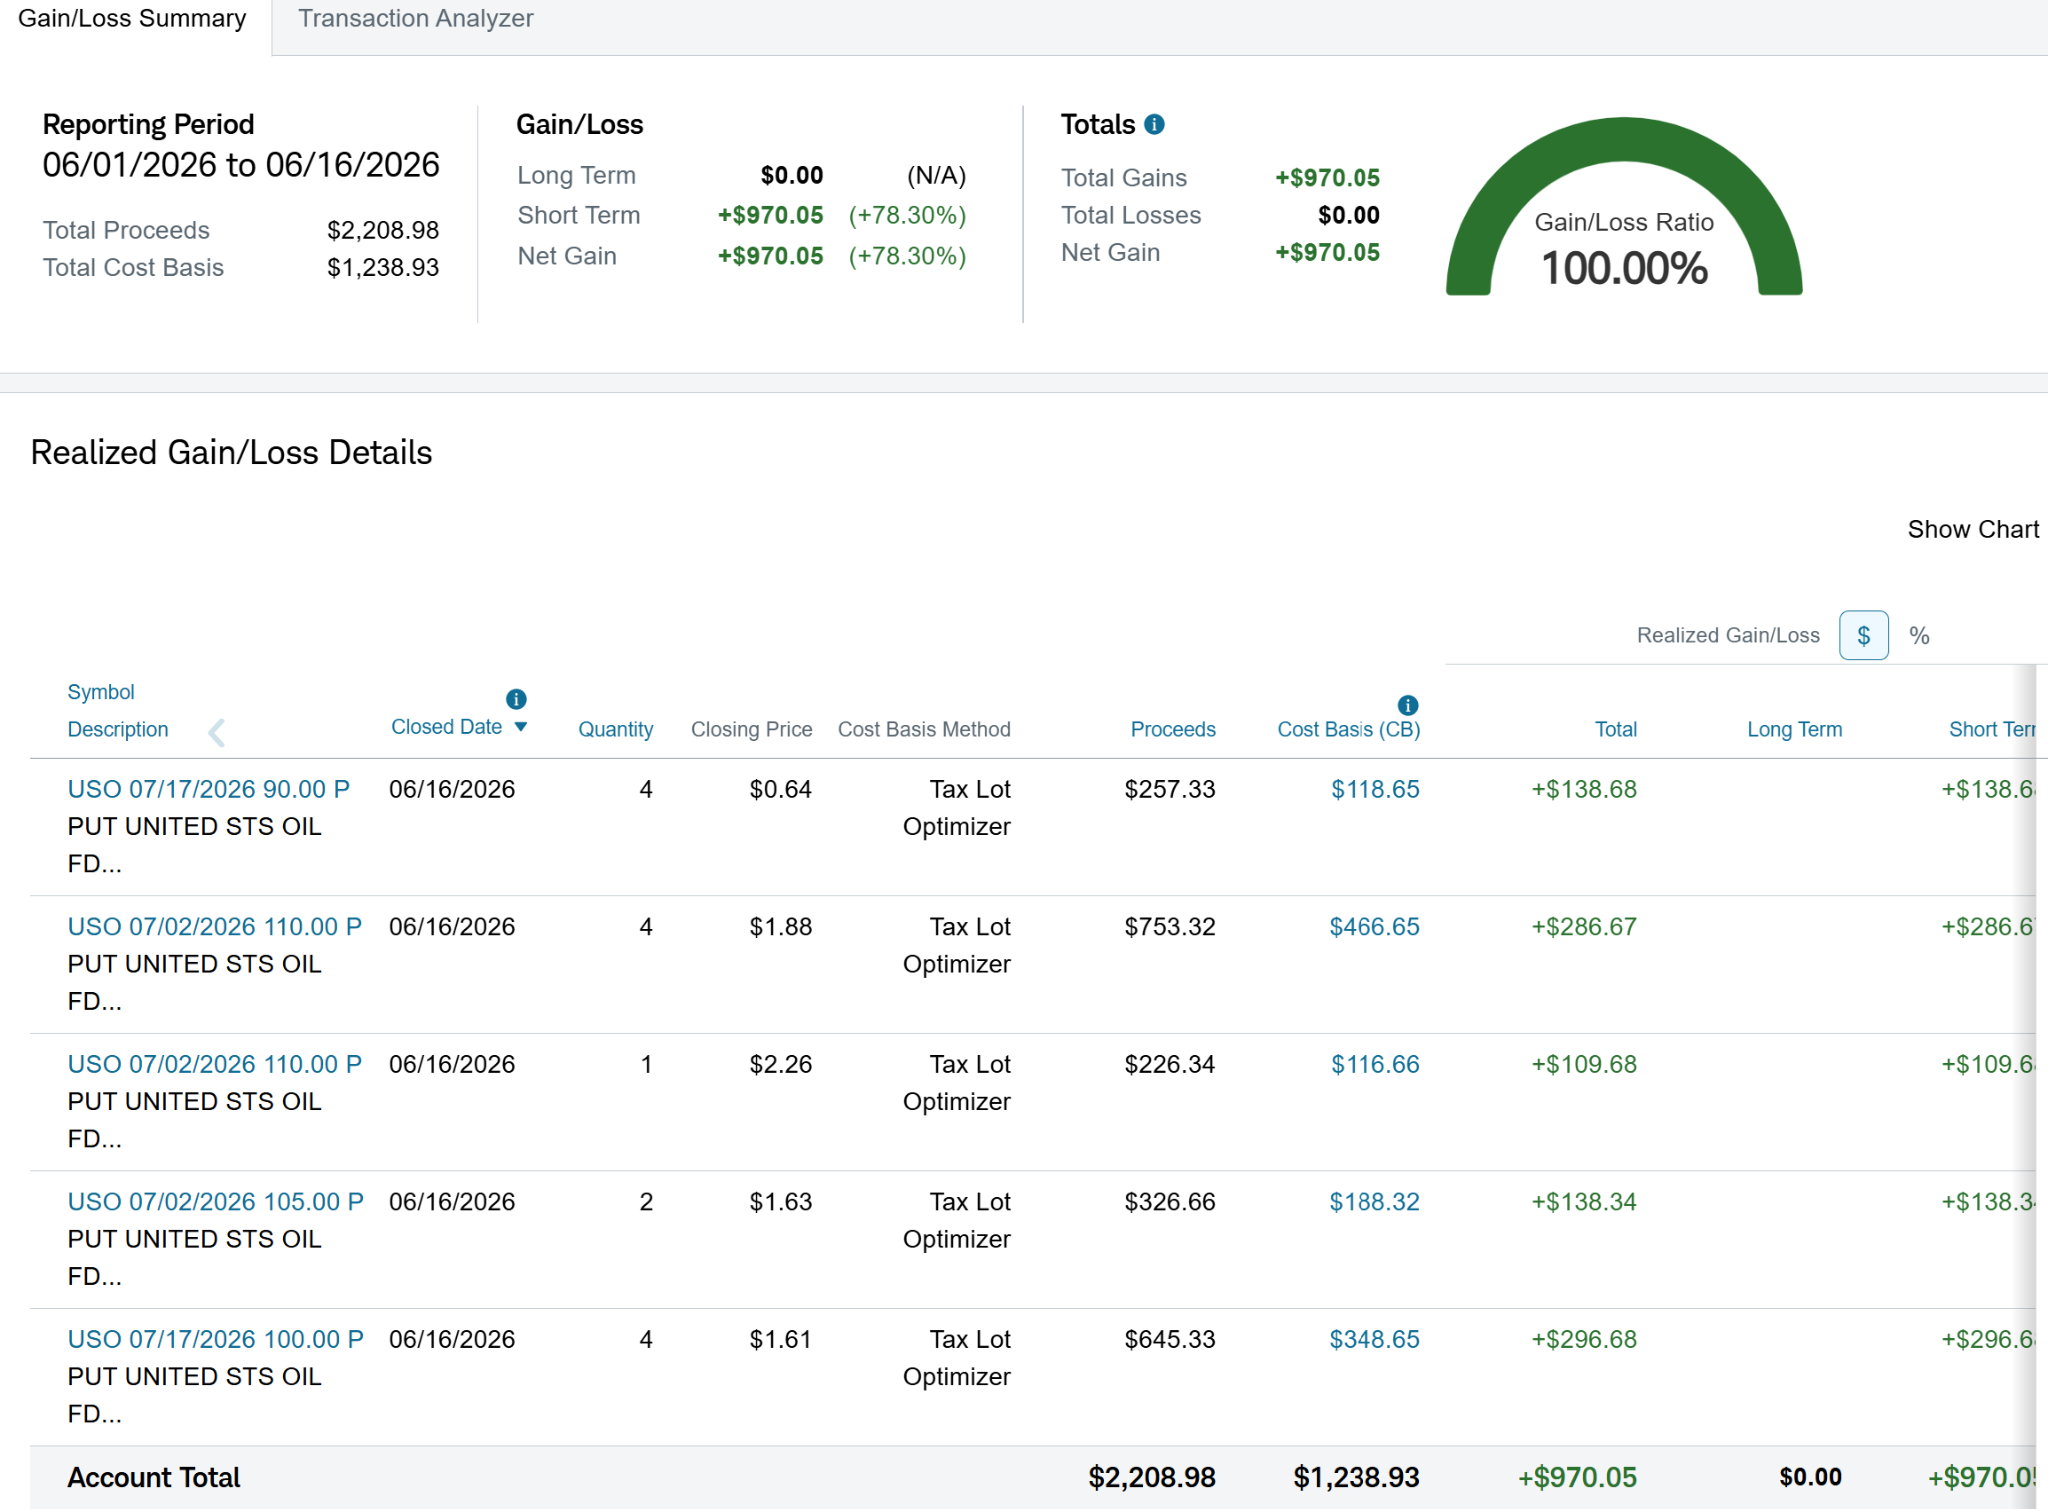
Let’s skip to the next day, June 16, and show a progress report.
If this is like most of my trading, I probably left some profits on the table. But my goal is to try to make an ongoing series of incremental gains, to supplement my very boring-but-effective bond ladder and longer-term investing activities.
My two trading goals are typically:
- Set a worst-case dollar loss.
- Get my money back through profit-taking, and then use the remaining capital to try to squeeze as much return as I can out of the trading position.
I call this “avoid big losses, then try to make as much as you can.”
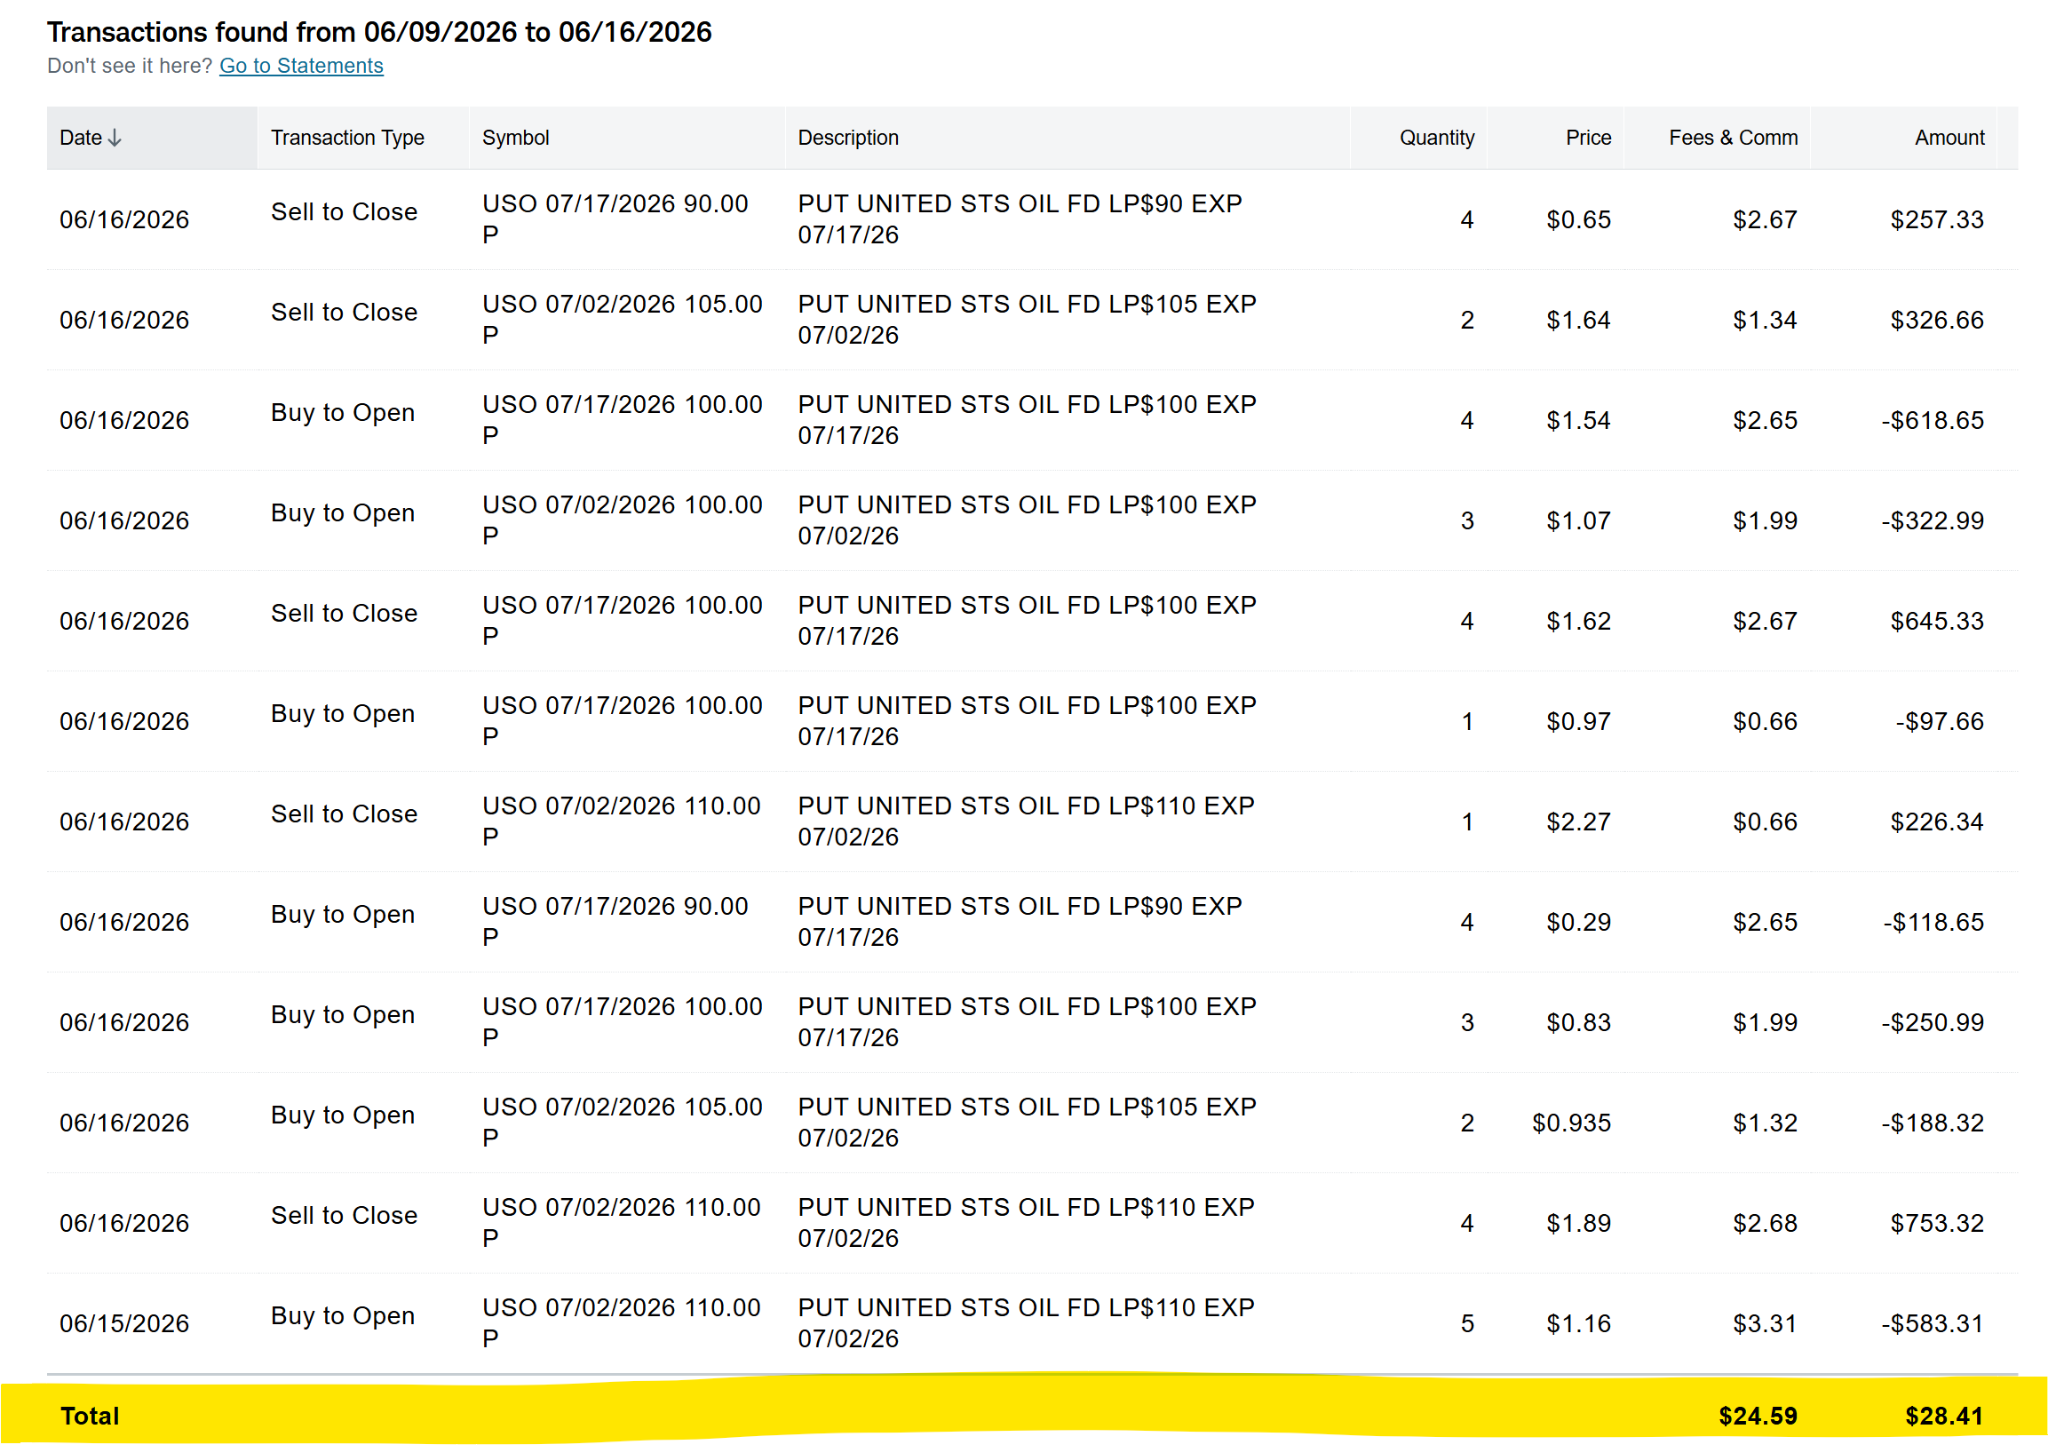
The above snapshot, with the yellow highlighted row, shows that in this case, it worked out. Those buy and sell transactions netted out to a slightly positive number. That means I made back my initial investment. And as of this writing, I had about $850 left invested. So that’s essentially all profit.
Now, a few days from now most of it can vanish, if I’m not nimble. But I’m focusing here on the “not losing big” aspect, and one way to try to get there, process-wise.
What’s next?
The trade performed rapidly, capturing a swift drop in USO within the first 24 hours. But the individual trade outcome is secondary to the repeatable process behind it. I’m 40 years into this, and I still learn every day. I have observed that there are traders who have been at it for a small fraction of that time, but they’ve cut off access to thinking beyond whatever they currently know.
My suggestion is to be a serial learner on your own. Otherwise, at some point, the markets will force you to become one.
Successful tactical trading is not about guessing wild macro directions or taking unhedged, oversized risks. It is about utilizing disciplined screening tools like the ones at Barchart.com to locate situations where the market might just afford you an edge. For me, everything starts with those Interactive charts, the same ones I feature in nearly every article I publish here.
For you? Just take a look at the site map. It is massive! From there, figure out what speaks to you, what fits your natural skillset (or the one you want to master) as an investor and trader. And make it happen.
By keeping position sizes strictly limited, defining your maximum loss at cost, and letting option leverage handle the upside, you tilt the mathematical odds completely in your favor. Keep your process structured, utilize your screening data to find the quiet air pockets in the market, and never risk a dollar more than necessary when hunting for high-return configurations.
Rob Isbitts created the ROAR Score, based on his 40+ years of technical analysis experience. ROAR helps DIY investors manage risk and create their own portfolios. For Rob’s written research, check out ETFYourself.com.
On the date of publication, Rob Isbitts did not have (either directly or indirectly) positions in any of the securities mentioned in this article. All information and data in this article is solely for informational purposes. For more information please view the Barchart Disclosure Policy here.
/Microsoft%20headquarters%20By%20Peter.jpeg)

/Amazon%20-%20Image%20by%20bluestork%20via%20Shutterstock.jpg)
/A%20close-up%20of%20the%20Broadcom%20logo%20on%20a%20smartphone%20by%20Timon%20via%20Adobe%20Stock.jpeg)