Gold & SP 500 Futures
Gold
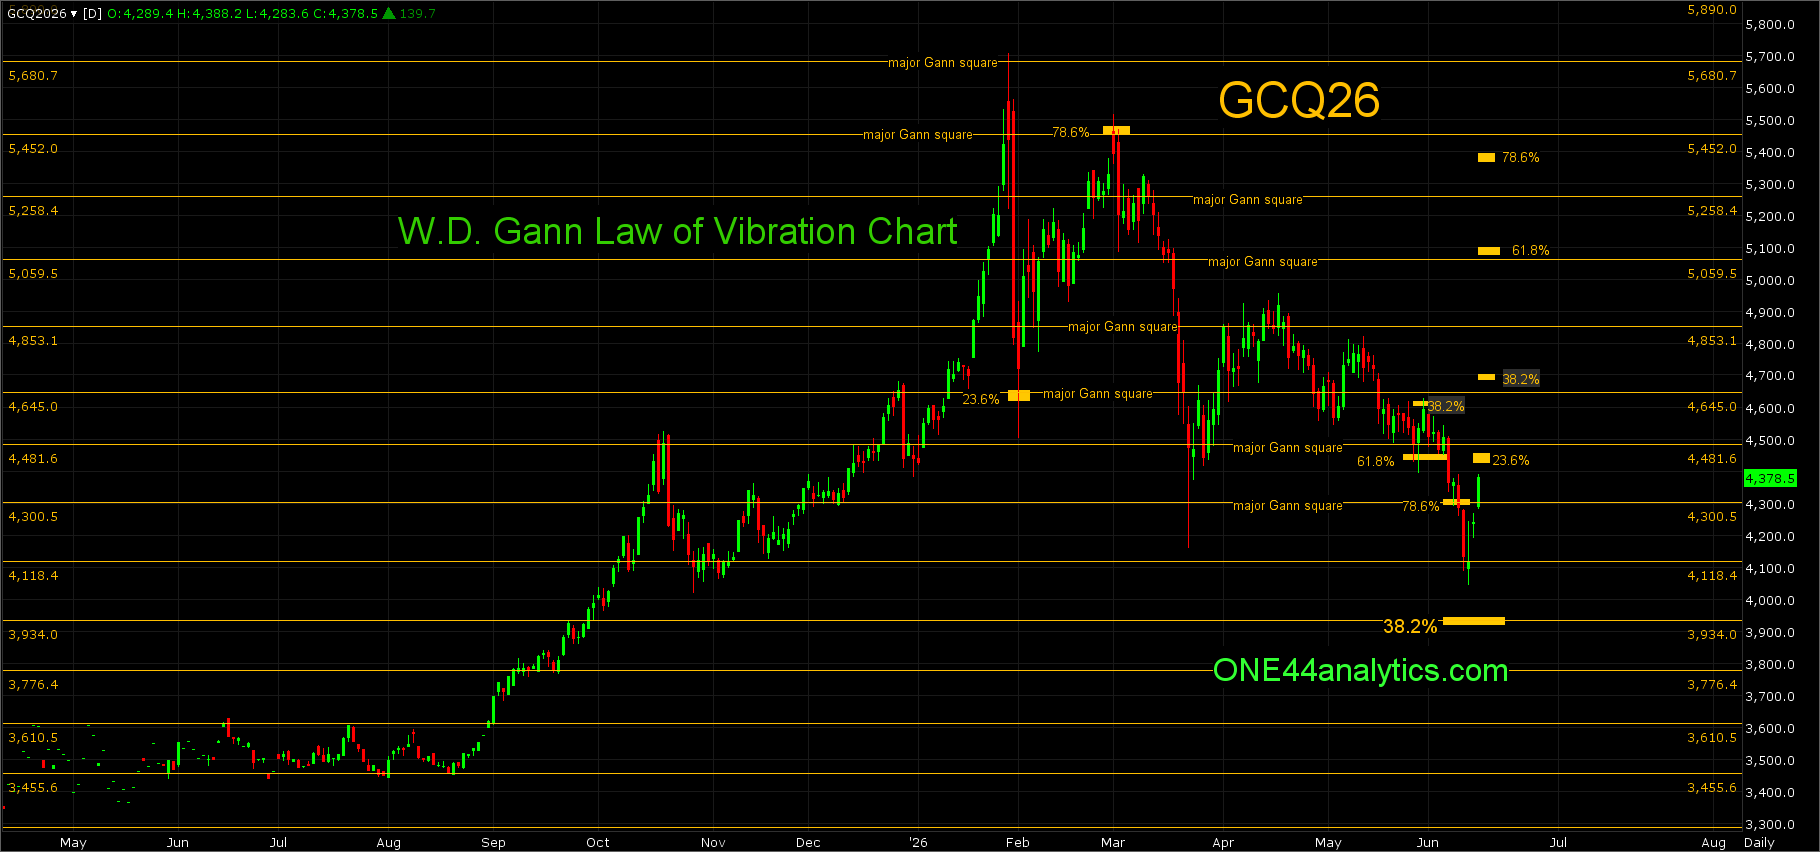
GCQ26
From last week,
The rally from a 61.8% retracement on 5/28/26 failed to get above 38.2% level at 4607.00 and that kept the short term trend negative. This is why we watch all the retracements on every move to see just how strong, or weak the market is regardless of the longer term target. The break below 61.8% at 4454.00 is currently holding above the 78.6% level and major Gann square at 4300.50 and this will be the key level for the week.
Use 4300.50 as the swing point for the week.
Below it, the short term target is the 4118.40 major Gann square. The long term target is 38.2% on the August continuation chart at 3934.00, this is also a major Gann square.
The market failed to turn higher at the 78.6% retracement of 4300.50 and made a new low for the move. It held the 4118.50 major Gann square and the rally from it is currently back above 78.6% and the 4300.50 major Gann square and this will be the key level for the week again.
Use 4300.50 as the swing point for the week.
Above it, the short term target area is the 4645.00 major Gann square and 38.2% back to the 1/29/26 high at 4681.00, this is the level that needs to be taken out to turn the short term trend positive again. Any rally that can't get above 23.6% of the same move at 4426.00 is a very negative sign and a new low can quickly follow.
Below it, The short term target is the 4118.40 major Gann square. The long term target is 38.2% on the August continuation chart at 3934.00, this is also a major Gann square.
If you would like free updates on Gold & SP Futures, Go Here.
SP 500 Futures
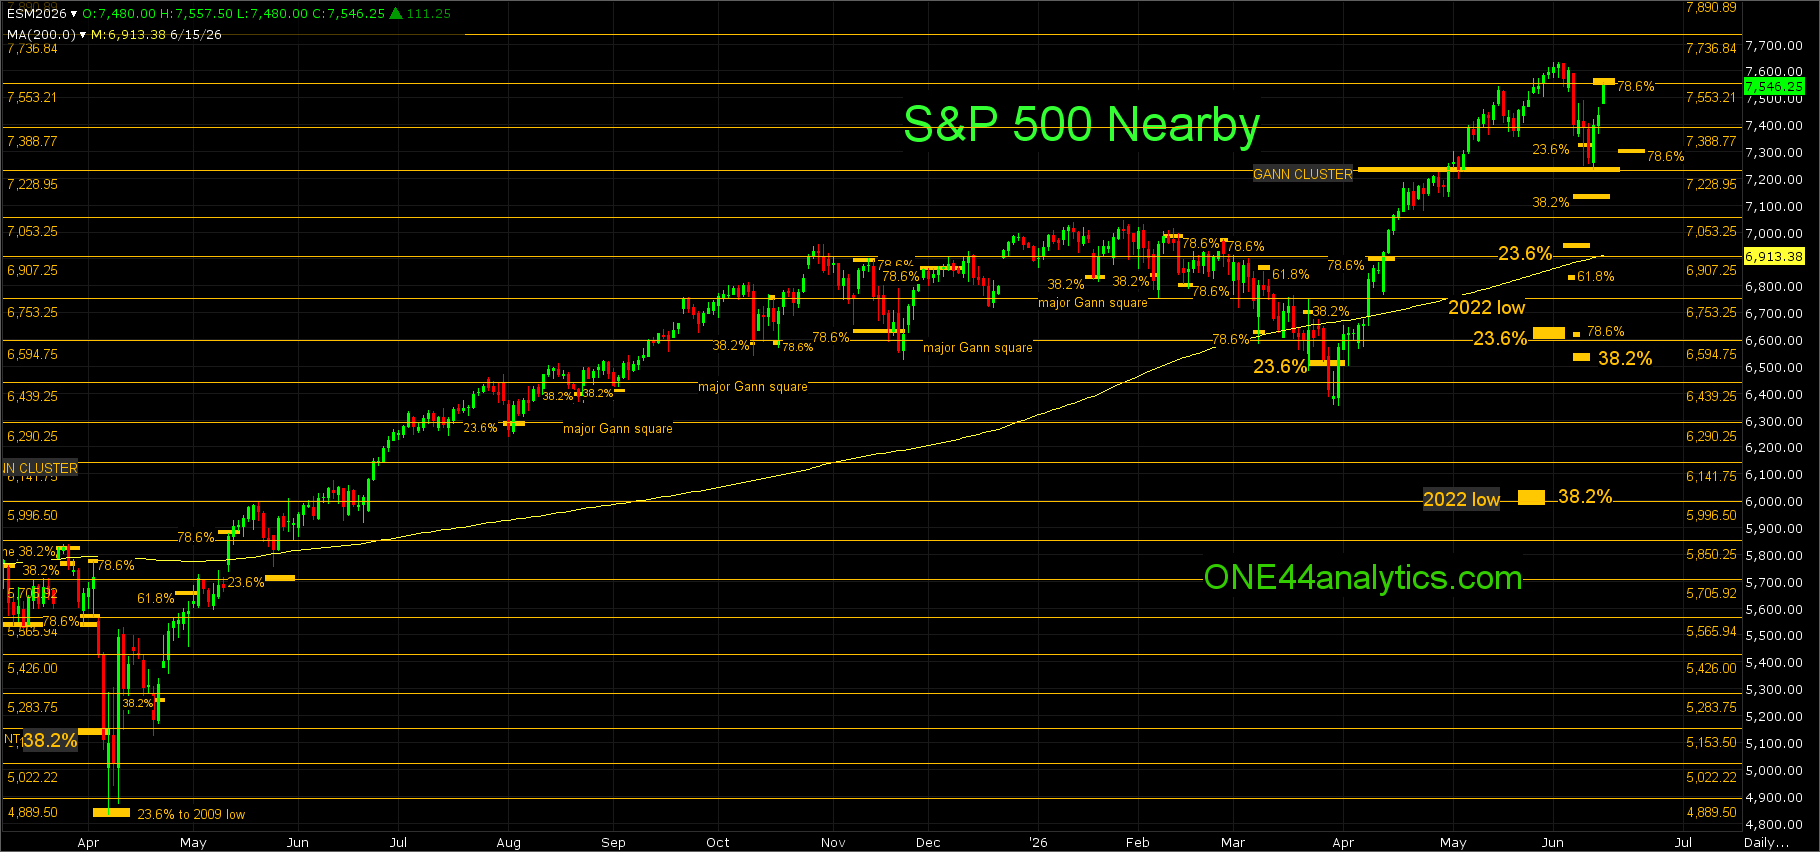
ESM26/ESU26
From last week,
To tell if Friday's action is the start of a longer term top we will watch all the retracement below starting with the ones from the 3/31/26 low. The break on Friday took it to and below the 7388.75 major Gann square and closed back above it and this will be the key level for the week.
Use 7388.75 as the swing point for the week.
Above it, the short term target is 78.6% back to the 6/1/26 high at 7569.00, this level should be adjusted with any new low this week. A failure.... As long as it remains above the 7229.00 major Gann square cluster the long term target is the next major Gann square cluster at 8237.50.
The Futures will be moving into the September contract, however we will still have to watch the June contract on the nearby chart for the week, when June goes off these levels will apply to September. The break to start the week had one close below 7325.00 (23.6%), it held above the major Gann square cluster at 7237.50 and closed back above 7325.00 the next day to keep the trend very strong. We will now watch the 78.6% retracement above that moved down to the 7553.25 with the new low this week This will be the key level for the week. A failure to make a new high in this area can cause the end of the rally for now (ONE44 78.6% rule) just as it did in AMZN and NVDA (shown in previous update).
Use 7553.25 as the swing point for the week.
Above it, a failure to turn lower from this area will give us only major Gann squares to look for resistance and then use as the swing point when it is closed above, the next two are 7736.75 and 7890.75.
Below it, The short term target is 78.6% the other way at 7306.00 per the ONE44 78.6% rule. The longer term target is 38.2% back to the 3/31/26 low at 7150.00 failing to hold this area would turn the short term trend negative. The long term target is 23.6% back to the 2025 low at 6963.00. If the market starts to melt down the first key area is 6645.00 to 6555.00, in this area it is 23.6% back to the 2022 low, 78.6% back to the 3/31/26 low and 38.2% back to the 2025 low.
ONE44 Analytics where the analysis is concise and to the point
Our goal is to not only give you actionable information, but to help you understand why we think this is happening based on pure price analysis with Fibonacci retracements, that we believe are the underlying structure of all markets and Gann squares.
If you like this type of analysis and trade the Grain/Livestock futures you can become a Premium Member.
You can also follow us on YouTube for more examples of how to use the Fibonacci retracements with the ONE44 rules and guidelines.
FULL RISK DISCLOSURE: Futures trading contains substantial risk and is not for every investor. An investor could potentially lose all or more than the initial investment. Commission Rule 4.41(b)(1)(I) hypothetical or simulated performance results have certain inherent limitations. Unlike an actual performance record, simulated results do not represent actual trading. Also, since the trades have not actually been executed, the results may have under- or over-compensated for the impact, if any, of certain market factors, such as lack of liquidity. Simulated trading programs in general are also subject to the fact that they are designed with the benefit of hindsight. No representation is being made that any account will or is likely to achieve profits or losses similar to those shown. Past performance is not necessarily indicative of future results.

/Micron%20Technology%20Inc_%20logo%20on%20building-by%20vzphotos%20vis%20iStock.jpg)


