Soybean Analysis & Targets
There are two methods we use at ONE44 to find support and resistance in the markets.
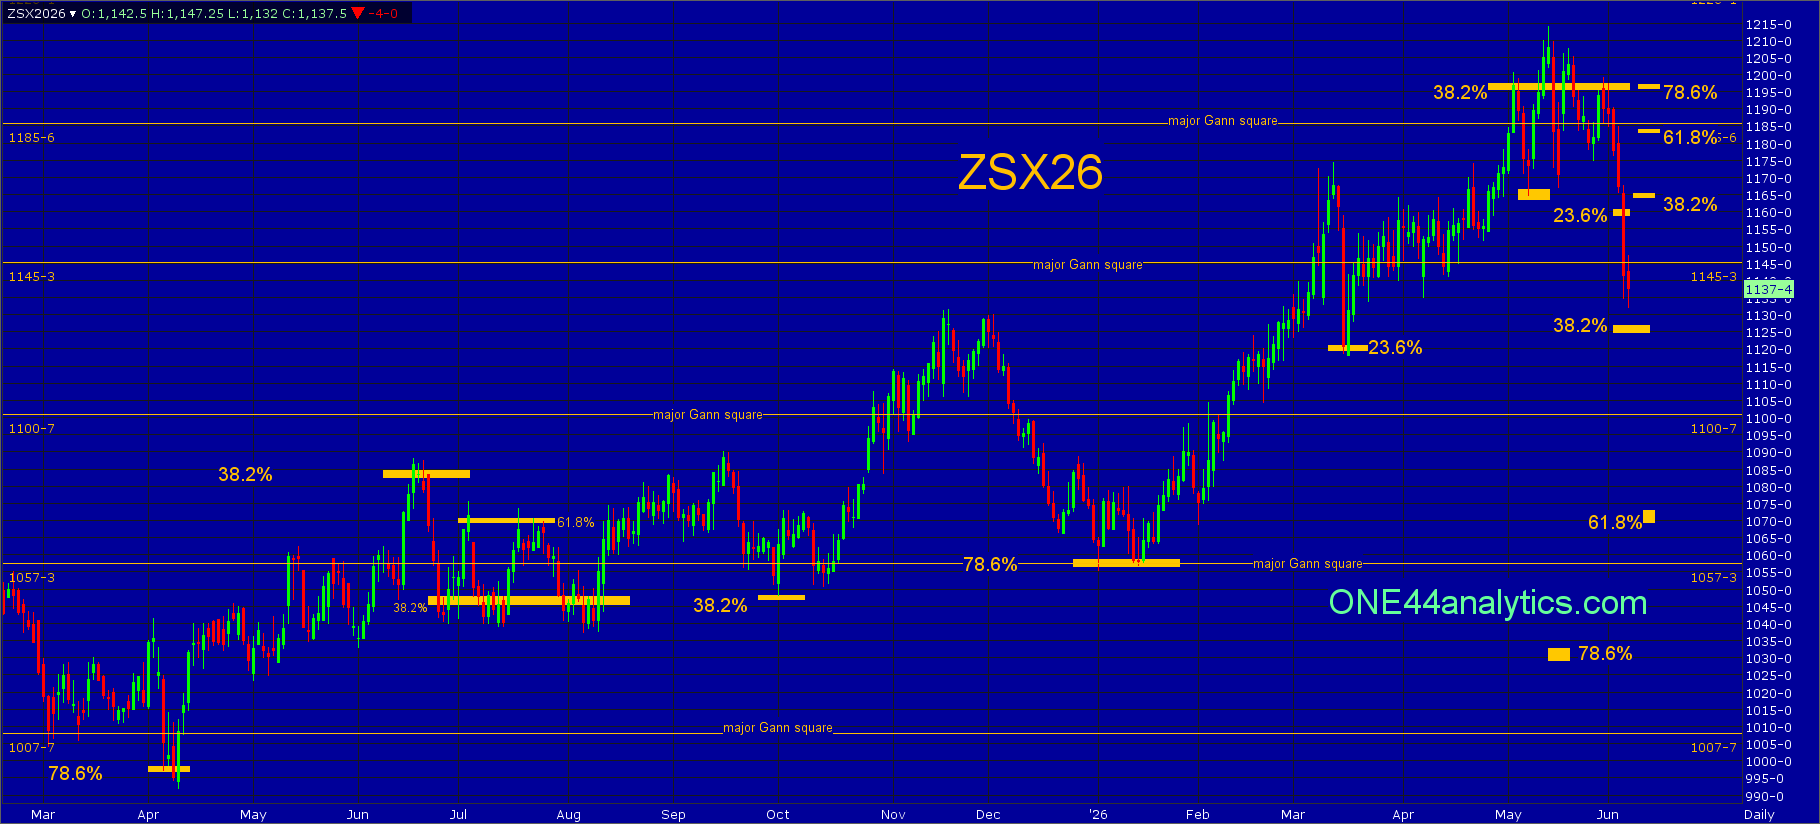
The first are major Gann squares, these are the yellow horizontal lines on the chart.
The second is Fibonacci retracements.
Here are a few basic rules when using the Fibonacci retracements with the ONE44 rules and guidelines.
This is the short version.
A 38.2% level keeps the trend intact and new highs/lows should follow.
A 23.6% level shows the market is extremely strong, or weak.
A 61.8% level can send the market 61.8% of where it just can from and cause wide swings keeping the market in a trading range.
A 78.6% level can send it 78.6% of where it just came from and even be the end or start of a Bull market.
We have done 45 videos on how to use the Fibonacci retracements with the ONE44 rules and guidelines. These Videos are worth watching even if it is not in the market you are trading, as the ONE44 rules and guidelines are the same for every market. You will also see why we believe the Fibonacci retracements are the underlying structure of ALL markets. Here is the latest.
Soybeans
November
From last week,
The break below the long term 38.2% level at 1196.00 again fell well short of the short term target of 23.6% at 1160.00 keeping this market extremely strong despite the big retracement at 1196.00, this will again be the key level for the week. A bigger setback is still possible from this area until it can get a couple solid closes above it. With no new high, or low all the Above/Below targets remain the same.
Use 1196.00 as the swing point for the week again.
This market collapsed after failing to get above the long term 38.2% level at 1196.00 keeping the long term trend negative and we will be looking for the short term trend swing point at 1127.00. With the close below the 1145.25 major Gann square this will be the key level for the week.
Use 1145.25 as the swing point for the week.
Above it, the short term target is 38.2% back to the 5/13/26 at 1166.00, this is the level that needs to be taken out to turn the short term trend positive. The longer term target is 1185.75, this is 61.8% of the same move and a major Gann square. The long term target is 78.6% at 1197.00, this would put it back at the long term swing point.
Below it, the short term target is 38.2% back to the contract low at 1127.00, this is the level that needs to hold to have a chance at going back to the long term swing point at 1196.00. The longer term target is the 1100.75 major Gann square. The long term target is 61.8% back to the contract low at 1073.00.
ONE44 Analytics where the analysis is concise and to the point
Our goal is to not only give you actionable information, but to help you understand why we think this is happening based on pure price analysis with Fibonacci retracements, that we believe are the underlying structure of all markets and Gann squares.
If you like this type of analysis and trade the Grain/Livestock futures you can become a Premium Member.
You can also follow us on YouTube for more examples of how to use the Fibonacci retracements with the ONE44 rules and guidelines.
Sign up for our Free newsletter here.
FULL RISK DISCLOSURE: Futures trading contains substantial risk and is not for every investor. An investor could potentially lose all or more than the initial investment. Commission Rule 4.41(b)(1)(I) hypothetical or simulated performance results have certain inherent limitations. Unlike an actual performance record, simulated results do not represent actual trading. Also, since the trades have not actually been executed, the results may have under- or over-compensated for the impact, if any, of certain market factors, such as lack of liquidity. Simulated trading programs in general are also subject to the fact that they are designed with the benefit of hindsight. No representation is being made that any account will or is likely to achieve profits or losses similar to those shown. Past performance is not necessarily indicative of future results.
/Micron%20Technology%20Inc_%20logo%20on%20building-by%20vzphotos%20vis%20iStock.jpg)


