
- Seasonal analysis is the study of how a market tends to move over a set period of time, usually 12 months, and is a reflection of both fundamentals and fund activity in the market.
- The first weekly close of January is important in the Energies sector as three of the four major markets tend to post their low closes before starting on uptrends of varying degrees.
- As one would expect, the picture is not as clear in natural gas, the famed Widow Maker.
Last week, the first week of January, brought with it a renewed focus on the Energies sector. There were the standard headlines about tension in the Middle East, including the ongoing war in the Gaza Strip and militants disrupting shipments across the Red Sea. There is something we have to understand about the energy sector and its multitude of geopolitical factors: There is almost always[i] chaos in the Middle East. For the most part, the markets have factored this in with higher implied volatility readings. Then when something new comes along, like Russia invading one of its sovereign country neighbors, short-term waves can occur in the markets.
However, when those waves pass the markets of the Energies sector tend to settle back into their seasonal patterns. Which brings us to today’s topic: Seasonal Analysis. What is seasonality? A way of tracking a market over a set period of time, usually 12 months[ii], that shows us: A) the usual changes in supply and demand over that period of time, and B) the normal flow of investment money into and out of a market[iii]. My approach to seasonal analysis differs from most others in two ways:
- First, I view seasonal patterns as a guide rather than a hard and fast rule. Some services break it down to exact days markets tend to make moves. Chaos Theory tells us this shouldn’t, most likely won’t work. However, we can use seasonal patterns to filter possible positions through[iv]. When a market is caught in a contra-seasonal trend (e.g. corn at this time) it tells us something has changed fundamentally.
- Second, I use seasonal indexes rather than average flat prices. Think of Live Cattle for example: If we were to base seasonal analysis on flat price, studies would’ve flattened out during the rally to historic highs during 2023. We wouldn’t have been able to compare normal seasonal moves. By using indexes based on percent change of average weekly closes, we can see how large the anomaly is when a market breaks out of previous price ranges (bringing price distribution studies, another filter, into play).
With all this in mind, let’s take a look at how the energy markets tend to play out over the course of a calendar year. For this discussion, we’ll start with King Crude Oil (one of the 3 Kings of Commodities).
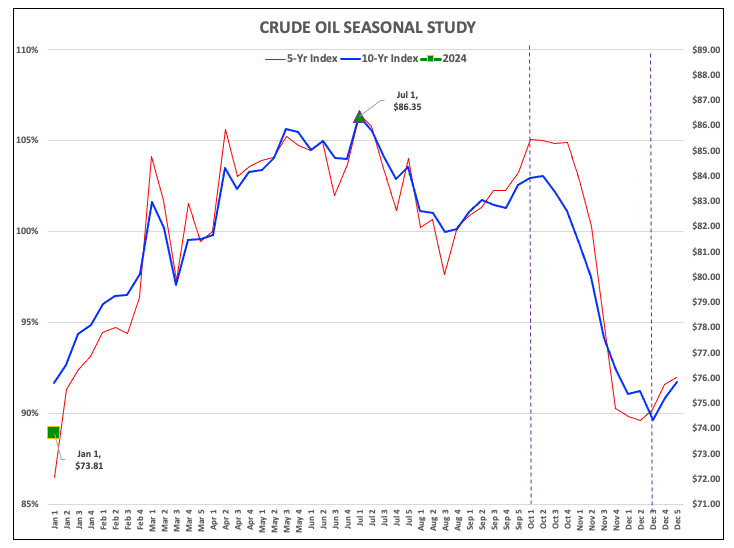
The spot-month WTI crude oil contract (CLG24) tends to post its low seasonal weekly close the first week of January. This makes seasonal analysis a bit easier. To calculate the possible high weekly close all we have to do is take the first mark and multiply times the change in the index, either the 5-year or 10-year[v], and come up with an average target. The spot WTI contract tends to gain between 14% (10-year) and 20% (5-year) from the first weekly close of January through the first weekly close of July. If we average those together at the beginning of 2024, and use last Friday’s close $73.81, the upside target for a high weekly close is near $86.35. Again, this is just a guide and not a hard and fast rule. We have to continue to monitor fundamentals (futures spreads, forward curves) and funds[vi], the latter group tending to set the trend (of any market).
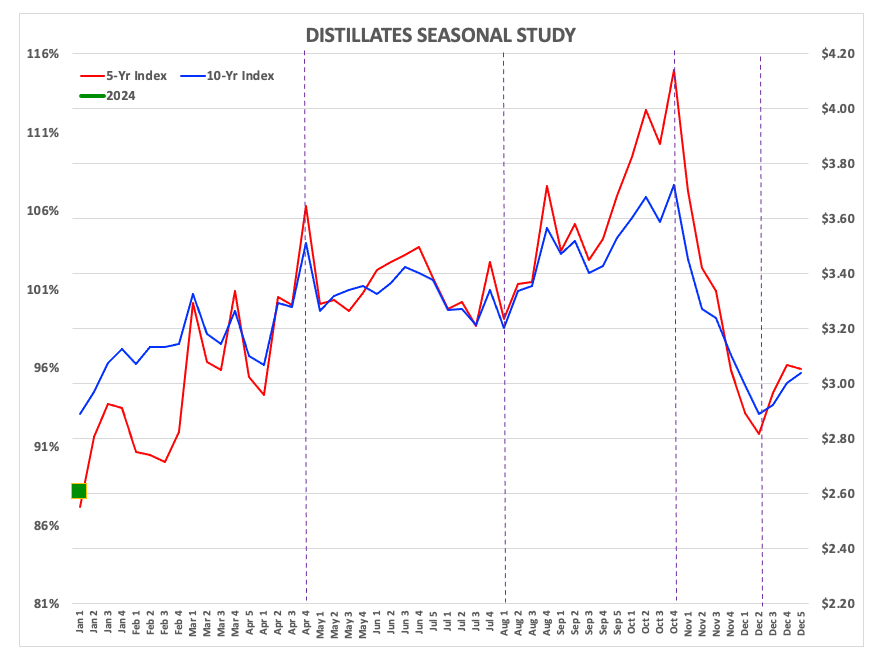
The spot-month distillates (heating oil, diesel fuel, jet fuel, etc.) contract (HOG24) tends to gain between 11% (10-year) and 19% (5-year) from the first weekly close of January through the last weekly close of April. Based on last Fridays close of $2.6085, the targets for high weekly closes are at roughly $2.90 and $3.10. However, the distillates market isn’t done at that point, settling into a sideways pattern through July before taking off to its seasonal high weekly close the last week of October. On average the market adds another 4% (10-year) to 9% (5-year) from its late April high weekly close. Those looking to lock in diesel or jet fuel needs tend to keep a close eye on the market’s seasonal patterns, including the immediate plunge back to a low weekly close in mid-December.
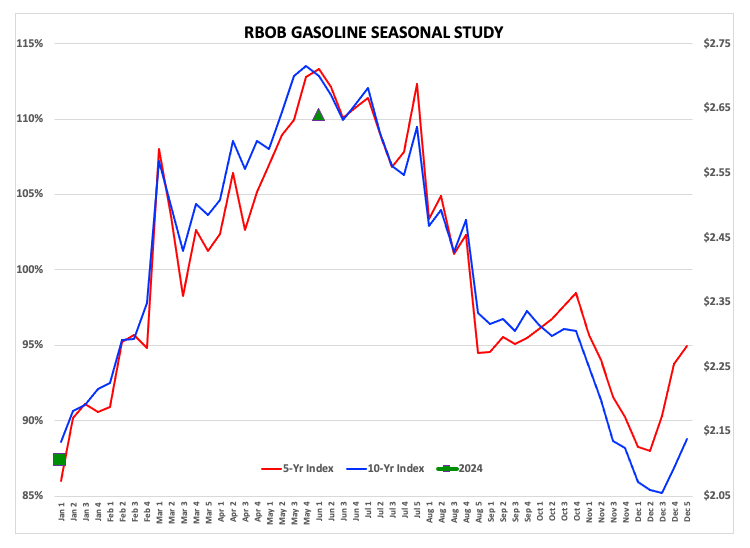
I recently talked about the seasonal patterns in RBOB gasoline (RBG24), with the key feature being average gains of 24% (10-year) and 27% (5-year) from the first weekly close of January through the first weekly close of June. Based on last Friday’s close by the spot-month contract at $2.1055, the target area for a high weekly close is between roughly $2.61 and $2.67, a narrower range than what we see in WTI and distillates.
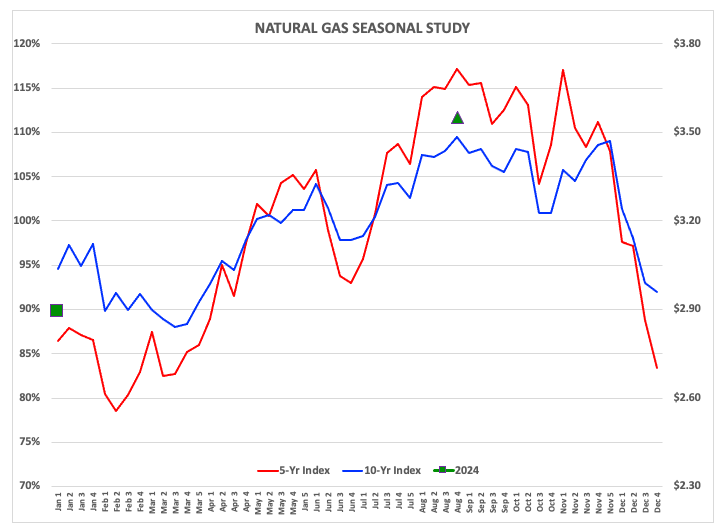
Last, but certainly not least, is our old friend the Widow Maker. As is only fitting, the natural gas market doesn’t show as clear-cut seasonal patterns between its 5-year and 10-year indexes. With the latter, the initial seasonal low weekly close occurs the third week of March and leading to a gain of 21% through the last week of August. The shorter-term 5-year index shows an average low weekly close the first week of February before gaining 37% through that same last week of August. This is the ‘normal’ pattern, but since we are talking about natural gas, we have to expect the unexpected as well.
A couple key takeaways from this discussion are: 1) The big three markets tend to rally from the first weekly close of January. 2) In early 2024, the market with the more bullish fundamentals, based on futures spreads, is distillates. Now we’ll see how the year plays out.
[i] Many in the industry tend to forget the Vodka Vacuity: There are no Absoluts in market analysis.
[ii] In Energies, I use a calendar year. Though I’m not a big fan of marketing year’s, I use those for markets in the Grains sector. Livestock are different in that I use the twelve months associated with the different contracts. If looking at the cash index, I go back to a calendar year.
[iii] Based on Newsom’s Market Rule #6, Fundamentals win in the end, funds tend to follow fundamentals.
[iv] Part of Newsom’s Market Rule #3: Use filters to manage risk. Seasonality is used along with price distribution and implied volatility.
[v]My seasonal analysis tends to focus on the previous 5-year and 10-year indexes. However, for long-term investment markets like US stock indexes, I also use 20-year and 30-yeaar studies.
[vi] The latest CFTC Commitments of Traders report (legacy, futures only) showed noncommercial traders held a net-long futures position of 163,729 contracts, one of its smallest net-long futures positions in over a decade. Why? Because the market’s forward curve is not as bullish as it has been in years past.
On the date of publication, Darin Newsom did not have (either directly or indirectly) positions in any of the securities mentioned in this article. All information and data in this article is solely for informational purposes. For more information please view the Barchart Disclosure Policy here.
/A%20Palantir%20office%20building%20in%20Tokyo_%20Image%20by%20Hiroshi-Mori-Stock%20via%20Shutterstock_.jpg)
/A%20hand%20holding%20a%20phone%20with%20the%20Reddit%20logo_%20Mamun_Sheikh%20via%20Shutterstock_.jpg)
/BlackRock's%20global%20headquarters%20By%20Tada%20Images.jpeg)
/The%20CoreWeave%20logo%20displayed%20on%20a%20smartphone%20screen_%20Image%20by%20Robert%20Way%20via%20Shutterstock_.jpg)
/Apple%20logo%20on%20store%20front%20by%20frantic00%20via%20iStock.jpg)