/Semiconductor%20chip%20by%20Mykola%20Pokhodzhay%20via%20iStock.jpg)
The Philadelphia Semiconductor Index ($SOX) is captured via the popular Semiconductor Ishares ETF (SOXX) — and it just hit a major milestone.
The Philly Semi Index recently crossed the 10,000 mark for the first time. That’s a milestone for sure. But at the same time, the underlying stocks in SOXX have an internal rift. Some semiconductor stocks have gone parabolic, while others are much flatter.
The Left SOXX Doesn’t Match the Right One
While the headline returns for semis look like a vertical line, the individual components are operating in two completely different universes.
If you are considering adding this exchange-traded fund (ETF) to your portfolio, you are essentially buying a concentrated bet on a few hyper-performers while simultaneously carrying a heavy load of industry laggards. You know, like a lot of today’s U.S. stock market.
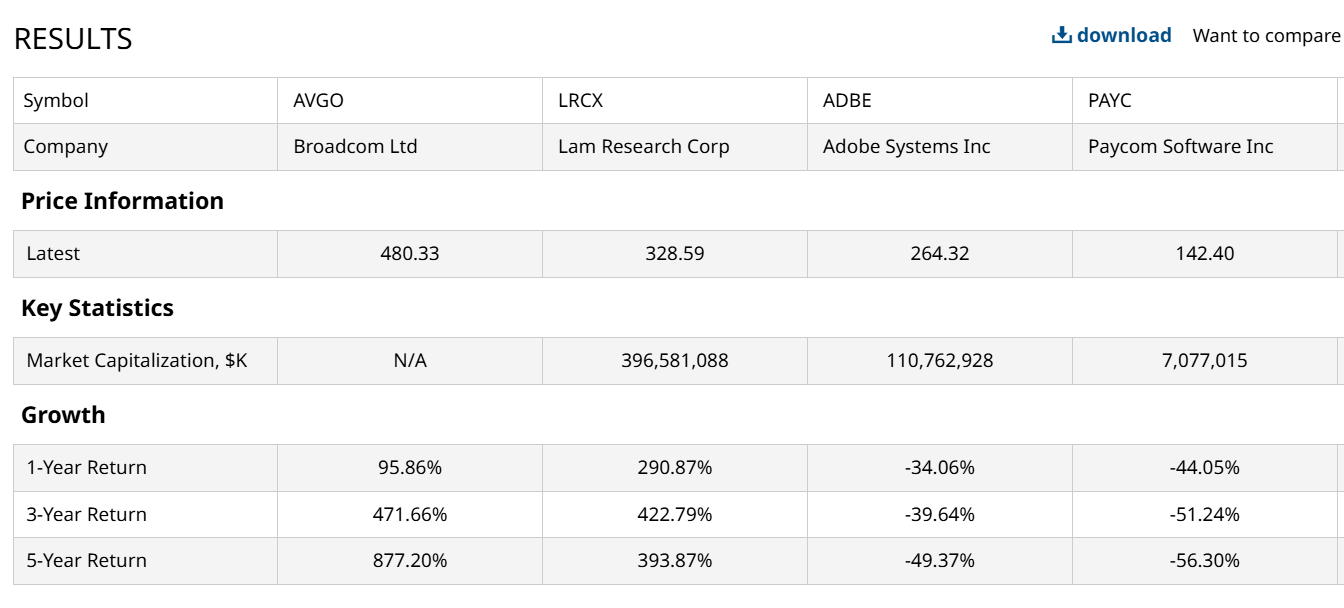
Just look at those gaudy trailing returns below. While the three-year and five-year returns indicate a two-year flat period in between, a 200% gain in either time frame is phenomenal. Even if it is narrowly based and has left SOXX’s portfolio selling at 69x earnings.
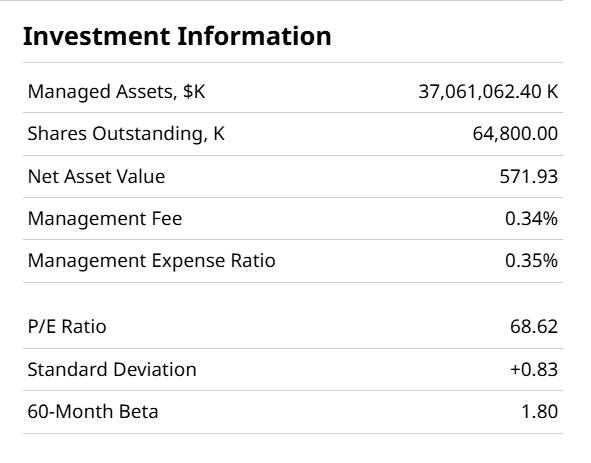
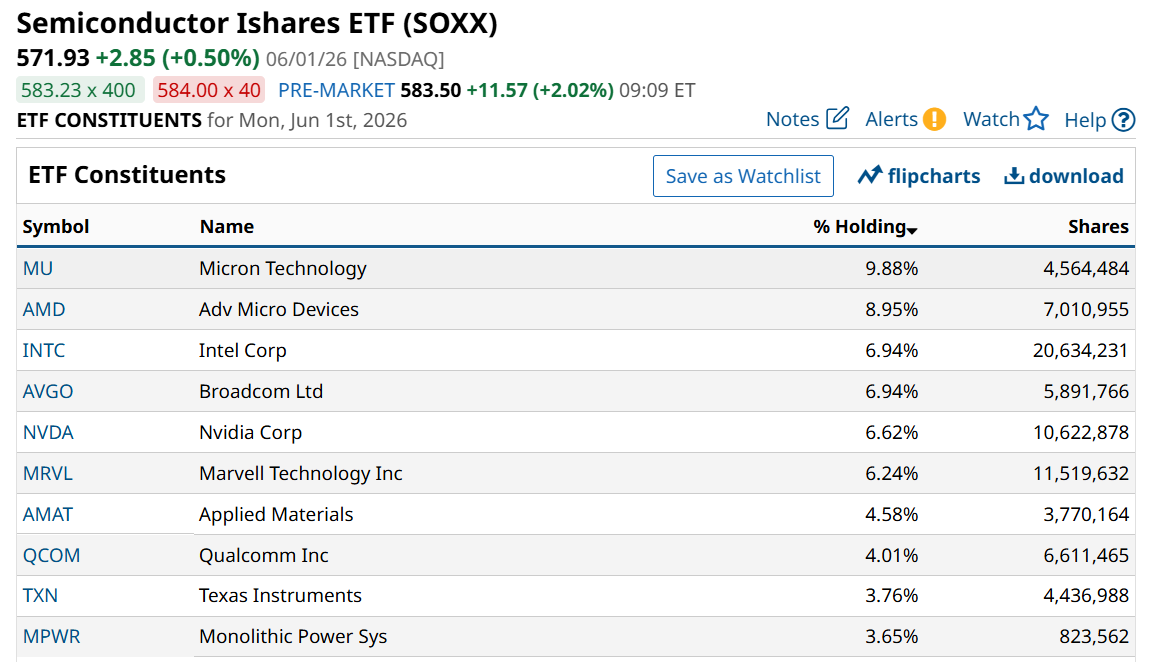
This $37 billion ETF is topped by some of the glamour stocks of this decade. The 10 largest make up about 60% of assets.
But check this out below. I cannot recall ever seeing this type of disparity in returns between any two pairs of stocks in the same industry. In the same ETF? Of course. But not among alleged peers. What the heck is going on here?
A Semi-Positive Story?
These aren't just speculative spikes in a few stocks. The winners are driven by the unrelenting demand for memory and processing power. Why? For the same reason anything in today’s stock market is assigned massive value and street cred. It is what is required to build out the global artificial intelligence (AI) infrastructure. AI stocks like these are functioning as an entirely separate asset class. As I’ve noted here recently, this prompts strong consideration when building ETF portfolios.
But while AI names are soaring, traditional, industrially focused semiconductor companies are telling a much more sober story. Several of SOXX’s 35 members, those that cater to the automotive and industrial sectors, are still working through excess inventory. And it creates stock price stagnation.
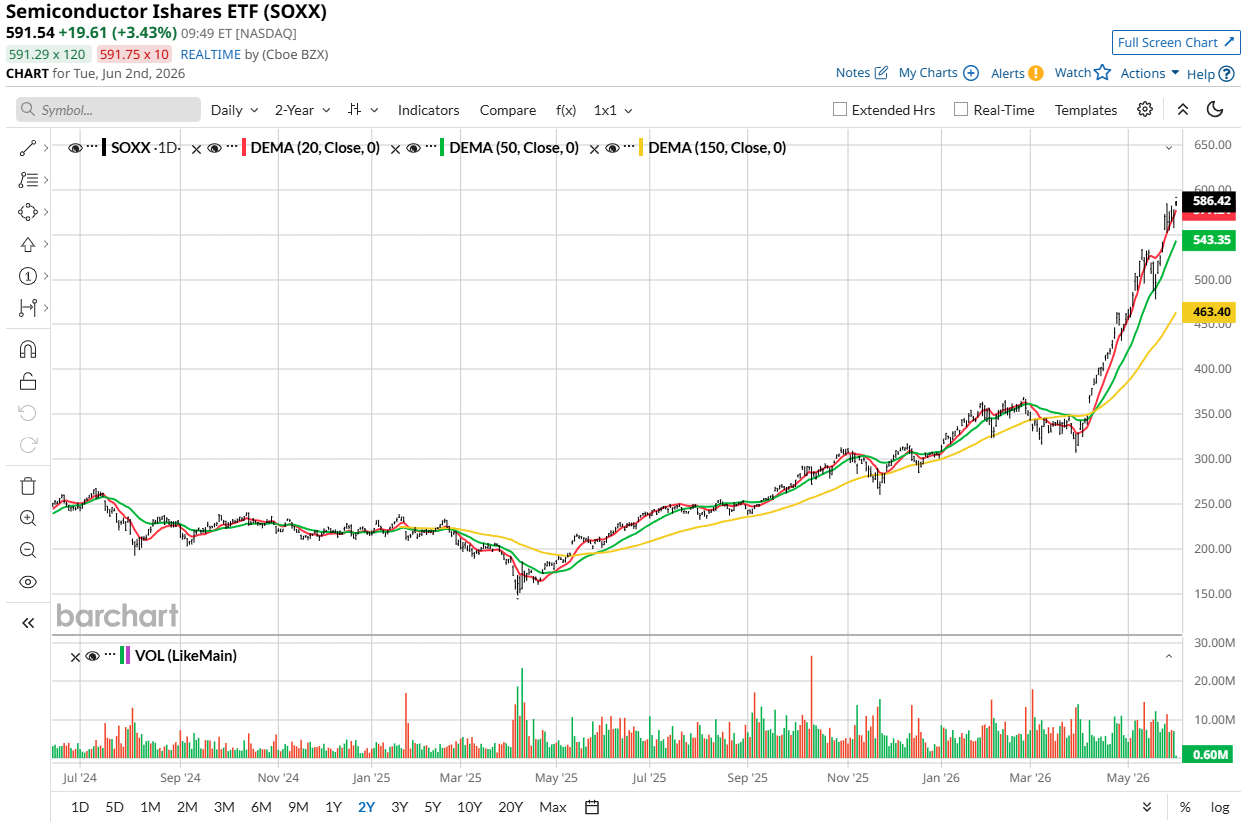
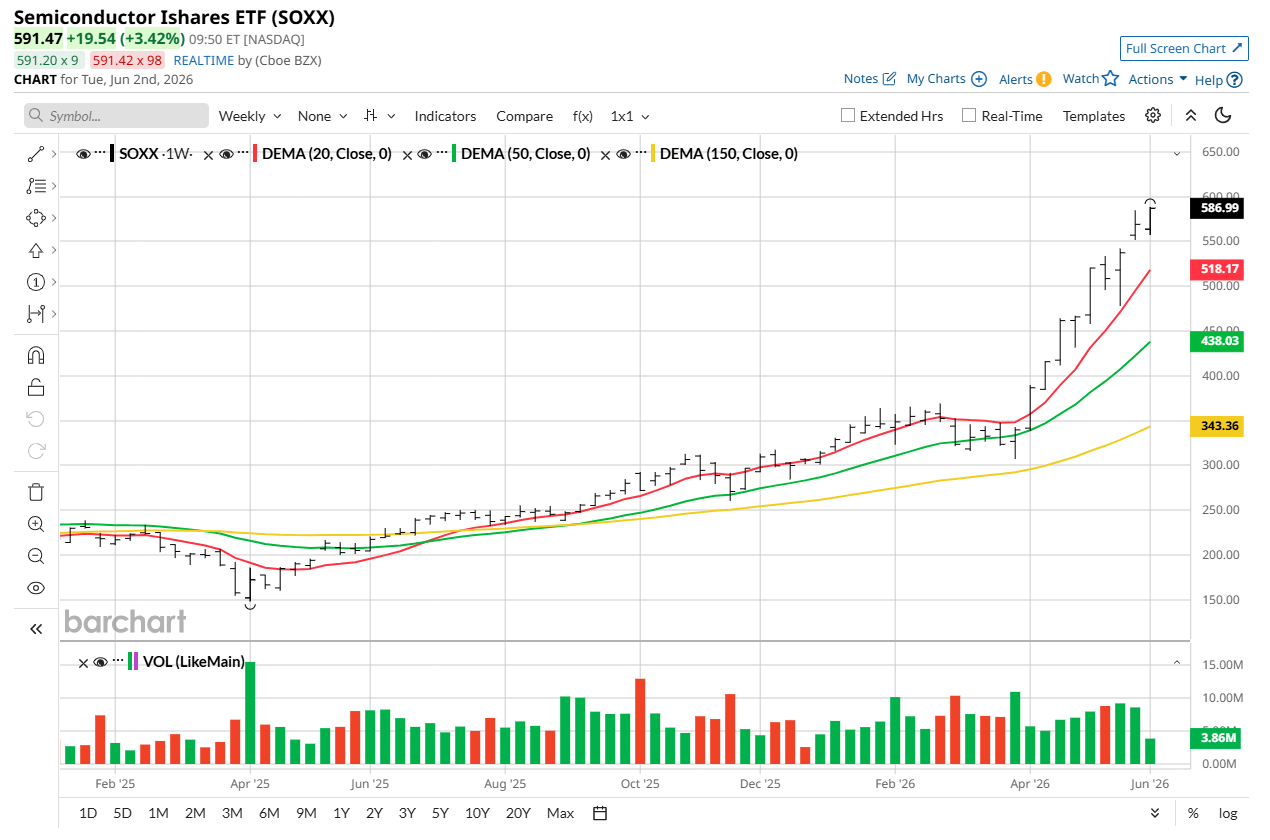
But you sure wouldn’t know it from looking at that daily price of SOXX above. Not in the least bit. That’s a rocket ship move. And it shows no signs of slowing.
SOXX has a weekly chart that just won’t quit either. That PPO indicator just set a new multi-year high. Translation: We’re in uncharted territory in the most literal sense.
The Bottom Line
That prompts the question: Is SOXX now a high-return, high-risk proposition? And which will win out as 2026 continues? That’s a good time to take a peek at its ROAR score, the indicator I use to gauge risk of major loss in any stock or ETF.
Frankly, this is what “buy and chill” looks like. ROAR is less about picking stocks and ETFs. It is all about trying to determine if a security is approaching a major drawdown. Like an insurance policy for ETF and stock holdings.
The ROAR score for SOXX has expectedly stayed in “extended but not yet poised to reverse lower" mode. That’s what an extended stay in the yellow/neutral-risk zone means.
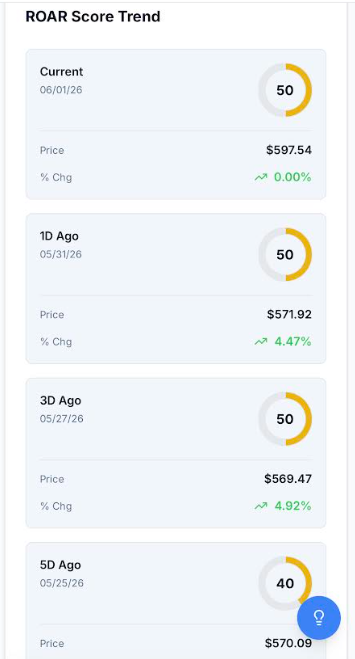
As SOXX has moved higher, ROAR has indicated that risk was stable (at 40 to 60 throughout). In other words, this has been a Goldilocks phase for what has been one of the most remarkable industry ETFs of our time.
Rob Isbitts created the ROAR Score, based on his 40+ years of technical analysis experience. ROAR helps DIY investors manage risk and create their own portfolios. For Rob's written research, check out ETFYourself.com.
On the date of publication, Rob Isbitts did not have (either directly or indirectly) positions in any of the securities mentioned in this article. All information and data in this article is solely for informational purposes. For more information please view the Barchart Disclosure Policy here.
/Alphabet%20Inc_%20and%20Google%20logos%20by%20IgorGolovinov%20via%20Shutterstock.jpg)
/Technological%20process%20of%20soldering%20chip%20components%20on%20PCB%20board%20by%20I%20Viewfinder%20via%20Adobe%20Stock.jpeg)

