/Microsoft%20France%20headquarters%20by%20JeanLuclchard%20via%20Shutterstock.jpg)
Microsoft Corp (MSFT) posted positive free cash flow for its fiscal Q3 ending March 31, albeit 22% lower than last year. This was despite an 84% hike in capex. However, its operating cash flow and margins were higher. As a result, MSFT stock could still be worth at least 27% more at $530 per share. This article will show why.
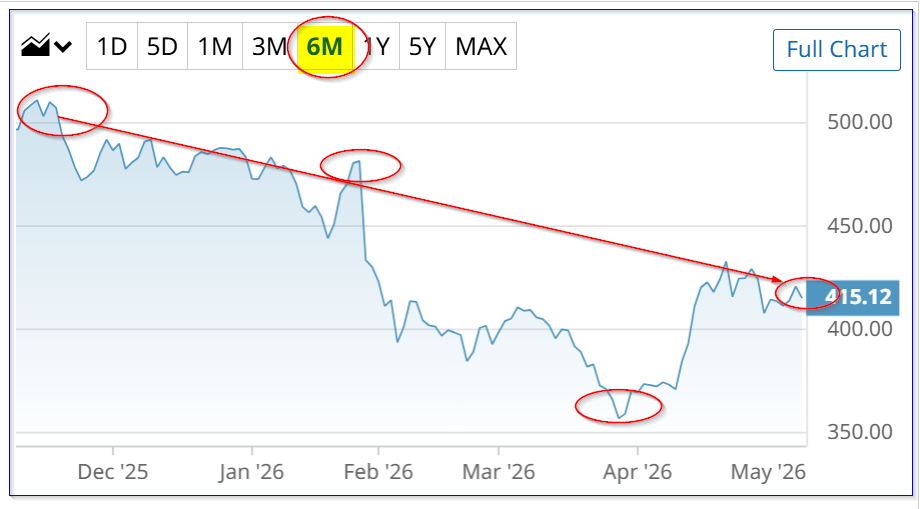
MSFT closed down 1.34% on Friday to $415.12, May 8, and is off a recent rebound to $432.92 as of April 22. Nevertheless, it's still well below its 6-month peak of $511.14 on Nov. 12, 2025.
Strong Operating Cash Flow
Microsoft generated $15.8 billion in FCF, down 22% from last year's $20.299 billion. However, its trailing 12-month (TTM) FCF was $72.916 billion, according to Stock Analysis, which was higher than last year's TTM FCF of $69.365 billion. However, it was below last quarter's TTM FCF of $77.412 billion.
Moreover, the TTM FCF margin was 22.91%, lower than last year's 25.69% TTM FCF margin and last quarter's 25.34% margin, again according to Stock Analysis.
Despite lower FCF results, mainly due to significantly higher capex, its Q1 operating cash flow (OCF) margin was higher. It came in at 56.3% of revenue (i.e., $46.68 billion OCF/ $82.89 billion revenue), compared to 52.9% last year (i.e., $37.04 billion/$70.07 billion).
Moreover, over the trailing 12 months (TTM), Microsoft has generated $170.4 billion in operating cash flow (OCF), compared to $130.7 billion last year, and even $160.45 billion last quarter, according to Stock Analysis.
Its TTM OCF was 53.5% of TTM revenue, up from 52.5% last quarter, as I described in my prior MSFT-related Barchart article on April 17.
This huge OCF funded over $97.2 billion in capex over the last year, up from $83 billion in TTM capex last quarter, mainly due to AI-related and cloud facilities spending. I expect that, based on management's comments, this will rise by at least another 10% over the next year.
Projecting FCF
As a result, we can project still higher FCF, even if capex rises another 10% over the next year. For example, analysts now project that revenue for the year ending June 30, 2027, will be $383.93 billion. (That's up from $378 billion as seen in my April 17 Barchart article - i.e., analysts have raised their revenue forecasts).
As a result, applying a 53.5% operating cash flow margin and 10% higher capex, FCF can be forecasted:
$383.93 billion x 0.535 OCF margin = $205.4 billion operating cash flow (OCF)
$205.4 billion OCF - ($97.2 billion x 1.17) capex = $205.4 b - $106.92 b = $98.5 billion FCF
That is still higher than the $72.9 billion in TTM FCF it generated this past quarter, according to Stock Analysis. In other words, despite higher capex, Microsoft is expected to make 35% higher FCF, almost $100 billion. This is similar to what I projected in my April 17 Barchart article - $99 billion in FCF for FY 2027.
As a result, Microsoft's valuation can reasonably be expected to rise.
Price Targets for MSFT Stock
If we assume that 100% of the FCF is paid out in dividends, the expected yield would be 2.36%. This is because its TTM FCF was $72.9 billion, and Yahoo! Finance says MSFT's market cap today is $3,084 billion:
$72.9b TTM FCF / $3,084 billion mkt cap = 0.0236 = 2.36% FCF yield
This is the same as multiplying FCF by 42.37x (i.e., 1/0.0236 = 42.37x). However, just to be conservative, let's use a higher FCF yield (i.e., a lower multiple). Using a 2.50% FCF yield is the same as multiplying FCF forecasts by 40x (i.e., 1/0.025 = 40x):
$98.5 billion FCF FY 2027 forecast (see above) x 40 = $3,940 billion market value
That's 27.76% higher than the $3,084 billion market cap today. In other words, the price target (PT) for MSFT is 27.8% higher:
$415.12 price Friday, May 8 x 1.2776 = $530.36 per share PT
That's just below my $531.84 PT last month, but still lower than other analysts' PTs. For example, Yahoo! Finance reports that 55 analysts have an average PT of $561.56 per share.
Similarly, Barchart's mean analyst survey has an average PT of $555.63 per share, and AnaChart's survey of 32 analysts has an average PT of $513.32 per share. So, other analysts' PTs average of $543.50, close to my PT of $530.36.
The bottom line is that MSFT still looks deeply undervalued, both based on FCF forecasts with higher capex forecasts, and analysts' price targets.
However, nothing is preventing MSFT from falling further. As a result, investors can set a lower buy-in price and get paid waiting by shorting out-of-the-money (OTM) puts.
Shorting OTM MSFT Puts
I discussed this in my last article on April 17, and it's worked out well. I suggested shorting the May 15 expiry 400 strike price put option for a $7.00 midpoint premium with 28 days left to expiry (DTE).
That out-of-the-money (OTM) put (i.e., 6% below the spot price) gave an investor an immediate 1.75% yield over one month (i.e., $7/$400 = 0.0175).
As of Friday, May 8, the midpoint premium had decayed to just $1.28 from $7.00. As a result, investors have made $5.72 over the past 21 days, while MSFT has fallen $10.57 from $415.69 on April 17.
Investors who followed this play will likely just hold their short-put play until expiry this week. They can also roll it over to the next month.
For example, the June 18 expiry put option contract shows that the $390 put contract, i.e., 6% out-of-the-money, has a midpoint premium of $5.50. So the yield is:
$550 / $39,000 = 0.141 = 1.41% for the next 40 days
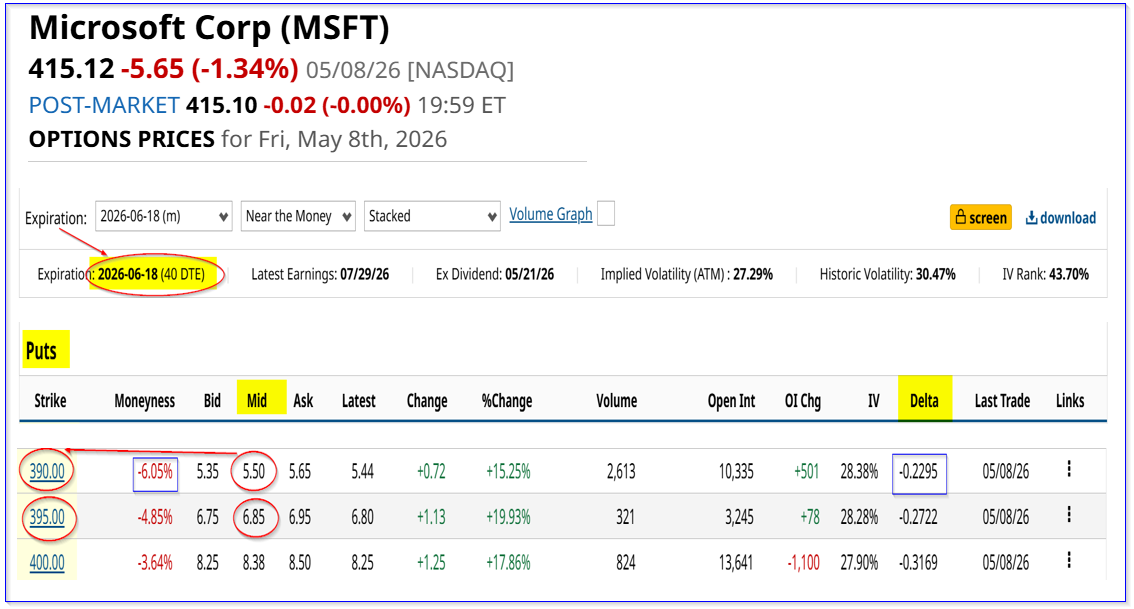
That is an attractive yield. Less risk-averse investors could short the $395 strike price put option, 4.85% OTM, for a $6.85 midpoint premium:
$6.85/$395 = 0.1734 = 1.734% short put yield
That would be similar to last month's put yield, but the distance is shorter from the spot price.
Nevertheless, the breakeven point is lower: $395 - $6.85 = $388.15, or 6.49% below the May 8 close of $415.12
The bottom line is that MSFT still looks cheap, and shorting out-of-the-money puts is an attractive way to play it over the next month.
On the date of publication, Mark R. Hake, CFA did not have (either directly or indirectly) positions in any of the securities mentioned in this article. All information and data in this article is solely for informational purposes. For more information please view the Barchart Disclosure Policy here.


/2d%20illustration%20of%20Cloud%20computing%20by%20Blackboard%20via%20Shutterstock.jpg)