/Microsoft%20Corporation%20logo%20on%20sign-by%20Jean-Luc%20Ichard%20via%20iStock.jpg)
Microsoft Corp. (MSFT) stock could be worth $4 trillion or $532 per share based on its strong free cash flow (FCF) and analysts' price targets. One way to play MSFT is to sell short one-month expiry out-of-the-money (OTM) put options. This article will explain why.
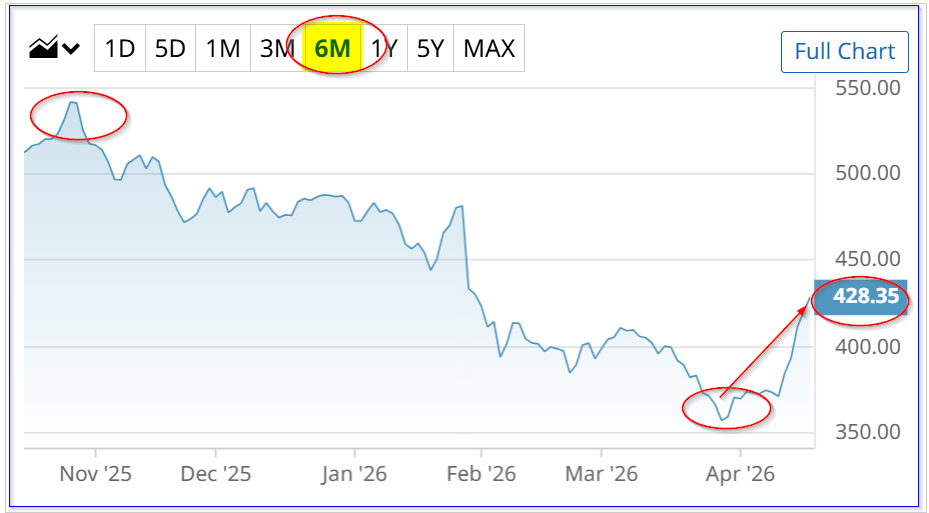
MSFT is trading at $426.84 in midday trading today, up about 2% and well over its recent lows. However, it's still well below its 6-month peak of $541.55 on Oct. 29, 2025.
It could be worth significantly more over the next year. I discussed Microsoft's strong FCF projections and its price target (PT) in a Jan. 30 Barchart article, “Microsoft's Free Cash Flow Crashes Due to High Capex - But Is MSFT Stock's Dip Overdone?”
Microsoft's FCF Estimates Are Higher, Based on Analysts' Estimates
Since then, analysts have raised their revenue estimates for the next fiscal year ending June 30, 2027. That raises its underlying value.
For example, Seeking Alpha's survey of 53 analysts now shows the average FY 2027 revenue forecast is $378.86 billion. Its operating cash flow (OCF) can be estimated with this forecast.
This is done by using its trailing 12 months (TTM) operating cash flow (OCF) margin (52.53% taken from Stock Analysis data, i.e., $160.5 billion TTM/$330.54 billion TTM revenue):
$378.96b FY 27 revenue x 0.525 = $199 billion OCF
Next, as I explained in my prior Barchart article, capex could rise to $100 billion from $83 billion over the TTM period (i.e., +20.4%). As a result, its FCF could reach almost $100 billion:
$199 billion OCF - $100 billion capex = $99 billion FCF
That would be 28% higher than the $77.4 billion in FCF it made over the last 12 months, according to Stock Analysis.
As a result, Microsoft's value could be much higher.
Price Targets for MSFT Stock
For example, using a 2.50% FCF yield metric, which is the same as multiplying FCF by 40x (i.e., 1/0.025 = 40x), Microsoft could be worth almost $4 trillion:
$99 billion x 40 = $3,960 billion market value
That is about 25% higher than today's market cap of $3,177 billion, according to Yahoo! Finance:
$3960b / $3,177 billion = 1.246 -1 = +24.6% upside
In other words, MSFT stock is worth 24.6% over today's price:
$426.84 x 1.246 = $531.84 price target (PT)
This is below other analysts' price targets. For example, Yahoo! Finance reports that the average PT of 57 analysts is $579.57 per share. And Barchart's mean analyst survey PT is $582.38. Moreover, 28 analysts surveyed by Anachart.com show an average PT of $604.35, significantly higher than its present price.
However, there is no guarantee that MSFT will rise to these PTs. Therefore, one way for value buyers to set a lower entry point is to sell short out-of-the-money (OTM) puts in one-month or shorter expiry periods.
That is because the put option premium tends to decay quickly over the last month. As a result, investors can get paid handsomely to wait until MSFT falls to the lower strike price.
Shorting OTM MSFT Puts
For example, the May 15 expiry period shows that the $400 strike price put option, over 6% lower than today, has an attractive $7.00 midpoint premium.
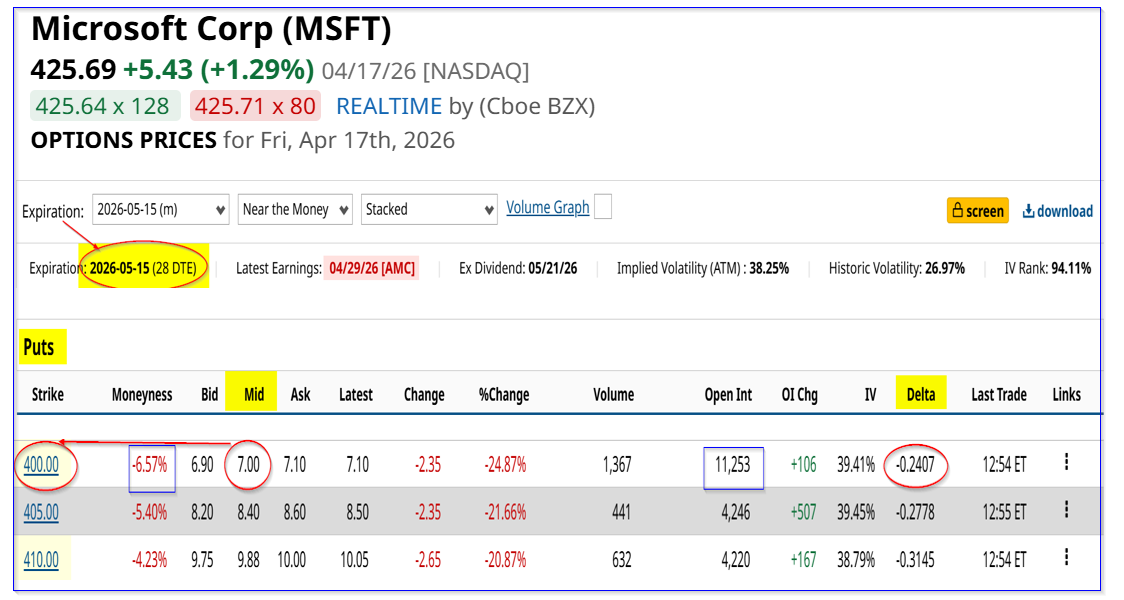
That means that an investor who secures $40,000 with their brokerage firm can enter an order to “Sell to Open” 1 put contract. As a result, their account will receive $700.
Therefore, the cash-secured put yield over the next month is:
$700 / $40,000 invested = 0.0175 = 1.75% short-put yield
That is a very attractive one-month return, especially if MSFT does not fall to $400 by then. Note also that the delta ratio is low at 0.24, implying less than a 25% chance this will happen.
Even if it does, the investor ends up with a lower breakeven investment cost:
$400 - $7.00 = $393.00 breakeven
That is 7.7% lower than today's price. Moreover, it allows a much higher potential return if MSFT stock rises to my $531.84 PT over the next year:
$531.84 / $393.00 cost = 1.353 -1 = +35.3% upside
The bottom line is that MSFT stock looks deeply undervalued here. One way for value investors to play MSFT stock is to short out-of-the-money puts.
On the date of publication, Mark R. Hake, CFA did not have (either directly or indirectly) positions in any of the securities mentioned in this article. All information and data in this article is solely for informational purposes. For more information please view the Barchart Disclosure Policy here.

/Space/Rocket%20launching%20into%20space%20by%20BEST%20BACKGROUNDS%20via%20Shutterstock.jpg)
/A%20Palantir%20office%20building%20in%20Tokyo_%20Image%20by%20Hiroshi-Mori-Stock%20via%20Shutterstock_.jpg)
/Close-up%20shot%20of%20Rivian%20R1T_%20Image%20by%20Trong%20Nguyen%20via%20%20Shutterstock_.jpg)
