- The cash price is the intrinsic value of a market and the best way to understand the real relationship between supply and demand (Economics 101).
- The ongoing 4-year pattern in cash corn resembles what we saw play out 10 years ago, with roughly 1.5 years remaining in this cycle.
- Corn's cash, futures, and fund markets all established long-term downtrends on their respective monthly charts during the spring of 2022.
Let’s do a bit of housekeeping before we get started with today’s discussion on cash corn:
- The cash price of a market is its intrinsic value. The better we understand this value the better we understand the market.
- Economics 101 teaches us that the point where the supply and demand curves meet is the market price. Therefore, even if we don’t know the actual numbers for supply and demand we can know the relationship between the two by studying the cash price (also known as the Unknown Variable Solution).
- The Analogy Fallacy tells us that because of Chaos Theory there is no such thing as an analogous year.
Okay, now that we have that cleared up, let’s talk about the cash corn market.
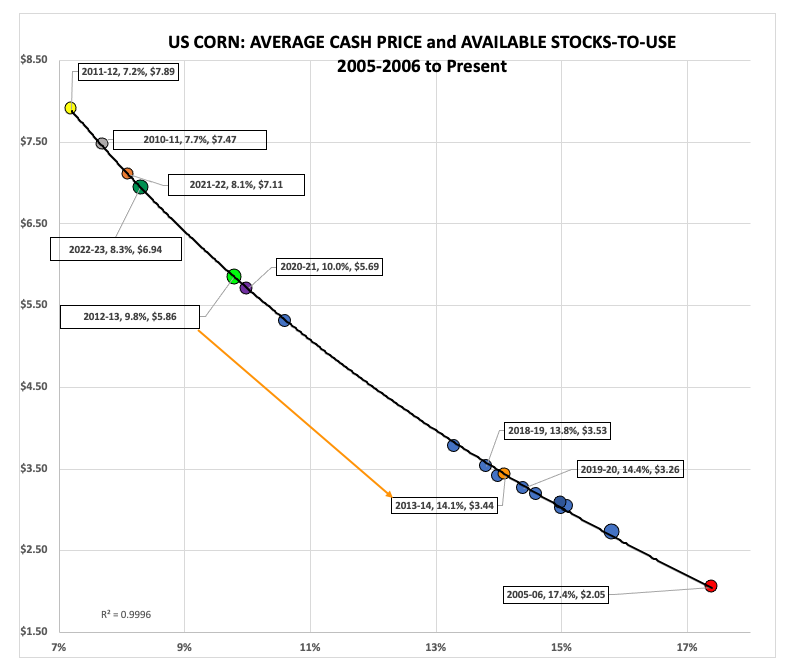
Most of you know I track monthly available stocks-to-use (as/u)[i] using national average cash price indexes. While I’m not a proponent of the concept of marketing years[ii], for comparison purposes I also chart my studies using the end of established marketing years. For the US corn market, the marketing year runs from September 1 through the following August 31. For my annual chart I pull the national average cash price on the last day of the marketing year and plot it on the line connecting past marketing years (in this case going back to 2005-2006, when the dynamics of the corn market changed). What I’m looking at this time around is what happened between the 2012-2013 marketing year and 2013-2014. We see on the chart that 12-13 ended with a cash price of $5.86 correlating to as/u of 9.8% (neon green marker). By the time we got to the end of 13-14 (orange marker) the cash index was $3.44 putting as/u at 14.1%.
What happened? Supply and demand changed. The US moved out of the three-year drought covering the 2010 through 2012 crops with rains returning to many key growing areas. Note on the previous chart those marketing years make up 3 of the 5 tightest as/u marketing years, interrupted by the 2021-2022 and 2022-2023 marketing years. Also note the pattern we see with 2020-2021 (purple marker) tightening to 2021-2022 (bronze marker) before loosening a bit through 2022-2023 (green marker). This follows the path laid out from 2010-2011 (silver marker) to 2011-2012 (gold marker) to 2012-2013. If that is the case, then could 2023-2024 show the same sort of loosening as 2013-2014? Most meteorologists I follow are talking about the end of La Niña, already evident in the rains seen across South America this season. If so, it could also mean more rain for the US Midwest this spring and summer. We've already seen late winter turn wetter for parts of key US growing areas.
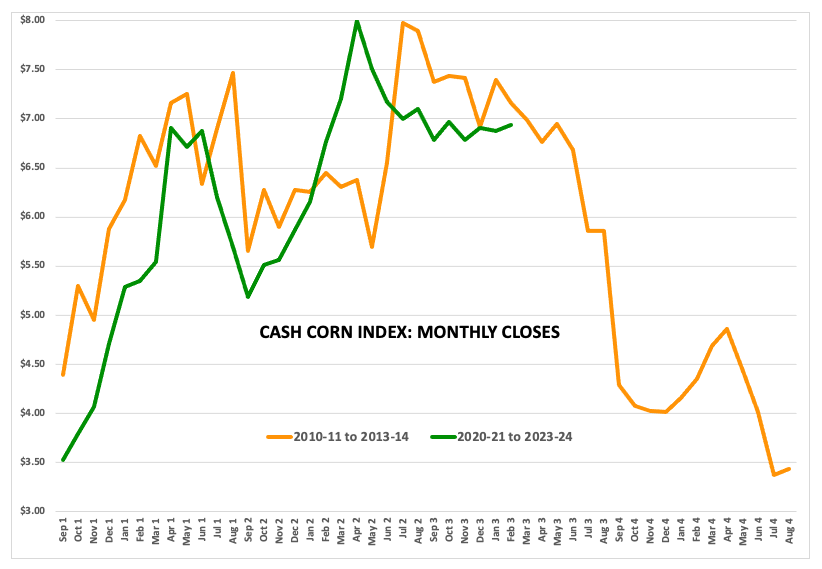
To study this idea closer, I’ve charted the monthly closes by the cash index, again using the Unknown Variable Solution to tell me as/u should be similar based on cash price values. What I found was the ongoing 4-year period is charting a similar course to the previous 4-year (September 1, 2010 through August 31, 2014). While this period started about $1.00 lower than a decade ago, both look to have established highs near $8.00. The first was a monthly close of $7.97 from July 2012 with the more recent at $8.00 from April 2022. The previous market then fell to a low of $3.37 at the end of July 2014, a decrease in value of 58%. If the cash index sees a similar decrease this time around it would put the price target near $3.38.
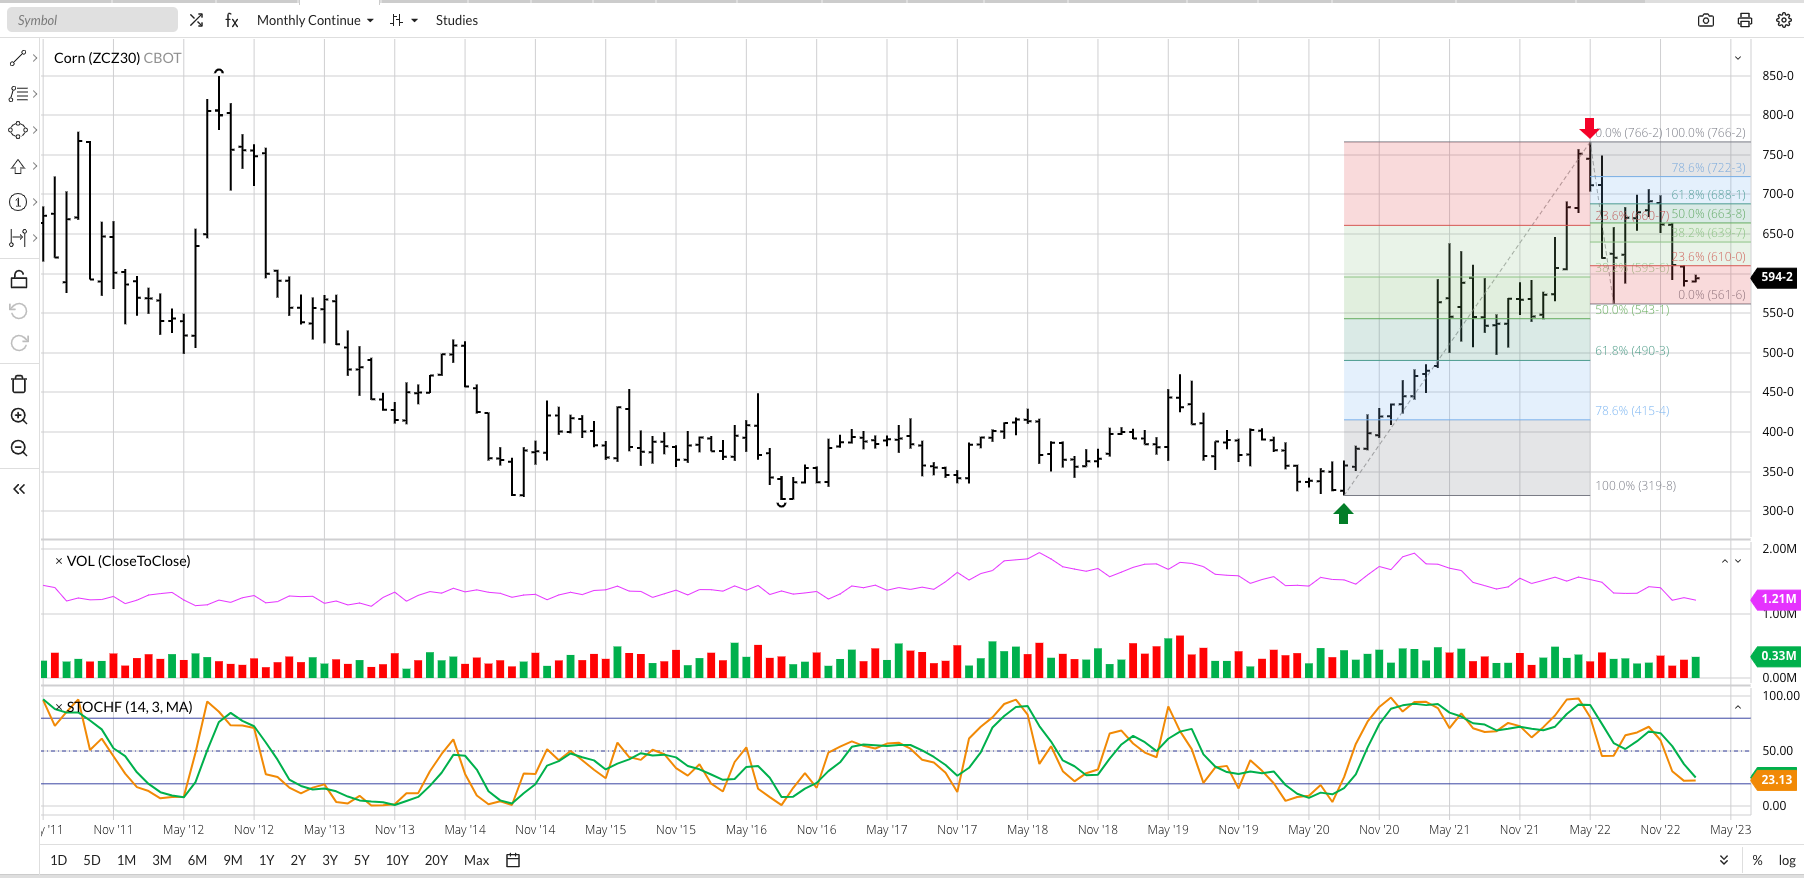
On my website I post Monthly Analysis for a number of markets, amounting to a version of an investment newsletter. Two of those markets are the Barchart National Corn Price Index (ZCPAUS.CM) and a continuous look at new-crop December futures[iii]. Both are showing long-term downtrends on their respective monthly charts dating back to May 2022. Notice this is just after the cash market posted its high monthly close of $8.00 last April. Most investors aren’t likely to be in the cash market, and my Theoretical Position has been to stay short December futures (ZCZ23), rolling 2022 futures to 2023 in mid-November. From a technical point of view the next downside targets are near $5.60, then $5.43 ($5.40 if we use corn’s characteristic Round Number Reliance). But that is a long way from putting cash near $3.40 another year down the road.
[i] My available stocks-to-use calculations are in no way, shape, or form based on USDA numbers but rather the study of national average cash indexes. Additionally, my figures are not ending stocks-to-use estimates so many in the industry talk about but a look at what the immediate supply to demand situation is. For longer-term analysis of supply and demand I use futures spreads.
[ii] I call this the Marketing Year Misdirection. The longer I’ve been in this business the less sense the idea of “marketing years” in grains and oilseeds makes. These are fluid, ever-changing markets, so cutting corn off on August 31 and saying it starts over again seems ridiculous. Like energies and metals, grains and oilseeds are also global markets with crops grown year-round. Think about how silly this makes marketing years seem for markets like soybeans and wheat.
[iii] In the Corn segment, I also look at the Teurcrium Corn Fund (CORN). This way I have cash, futures, and an ETF for subscribers to consider.
More Grain News from Barchart
- Wheats Close Red on Tuesday
- Soy Markets Close mostly Red
- Tuesday Corn Closes Mixed
- The Best Chocolate Stock to Buy for Valentine’s Day and Beyond
On the date of publication, Darin Newsom did not have (either directly or indirectly) positions in any of the securities mentioned in this article. All information and data in this article is solely for informational purposes. For more information please view the Barchart Disclosure Policy here.


/Delta%20Air%20Lines%2C%20Inc_%20passanger%20plane-by%20viper-zero%20via%20iStock.jpg)
/A%20close-up%20of%20a%20General%20Motors%20corporate%20sign%20by%20lindaparton%20via%20Adobe%20Stock.jpeg)