- The March S&P 500 futures contract has been completing bearish technical patterns of late on its daily chart, indicating its short-term trend has turned down.
- However, the index itself still shows an intermediate-term uptrend on its weekly chart.
- Investors are likely looking at the S&P 500 long-term monthly chart where the trend turned up this past October.
While visiting Kansas City last summer, I found myself in one of those stores that sells knickknacks – you know, dust collectors for the home. However, one sign caught my eye that read, “Alcohol: Because No Great Story Ever Started With Someone Eating A Salad”. (You can see a picture of this sign on my Twitter page, ‘Cheers!’ list.) This does lead to a short story, that may well have had something to do with alcohol.
As some of you know, the first trade I ever put on for myself was S&P 500 put options the week before Black Monday 1987. Once I cashed out that Friday (my options expired before the actual Monday collapse), we celebrated that afternoon and evening with beers at the local small-town pub. A couple years down the road, after I’d become a broker and still having no clients, being young and foolish I put an order in for myself to buy 10 S&P 500 futures contracts at the market. Did I have the 10s of thousands of dollars to cover the margin? Absolutely not. The clearing firm immediately called my boss and he took over trading me out of the position. We made a little money, but I was told in no uncertain terms this would never happen again.
As the song goes, “Memories, light the corners of my mind. Misty watercolor memories…”
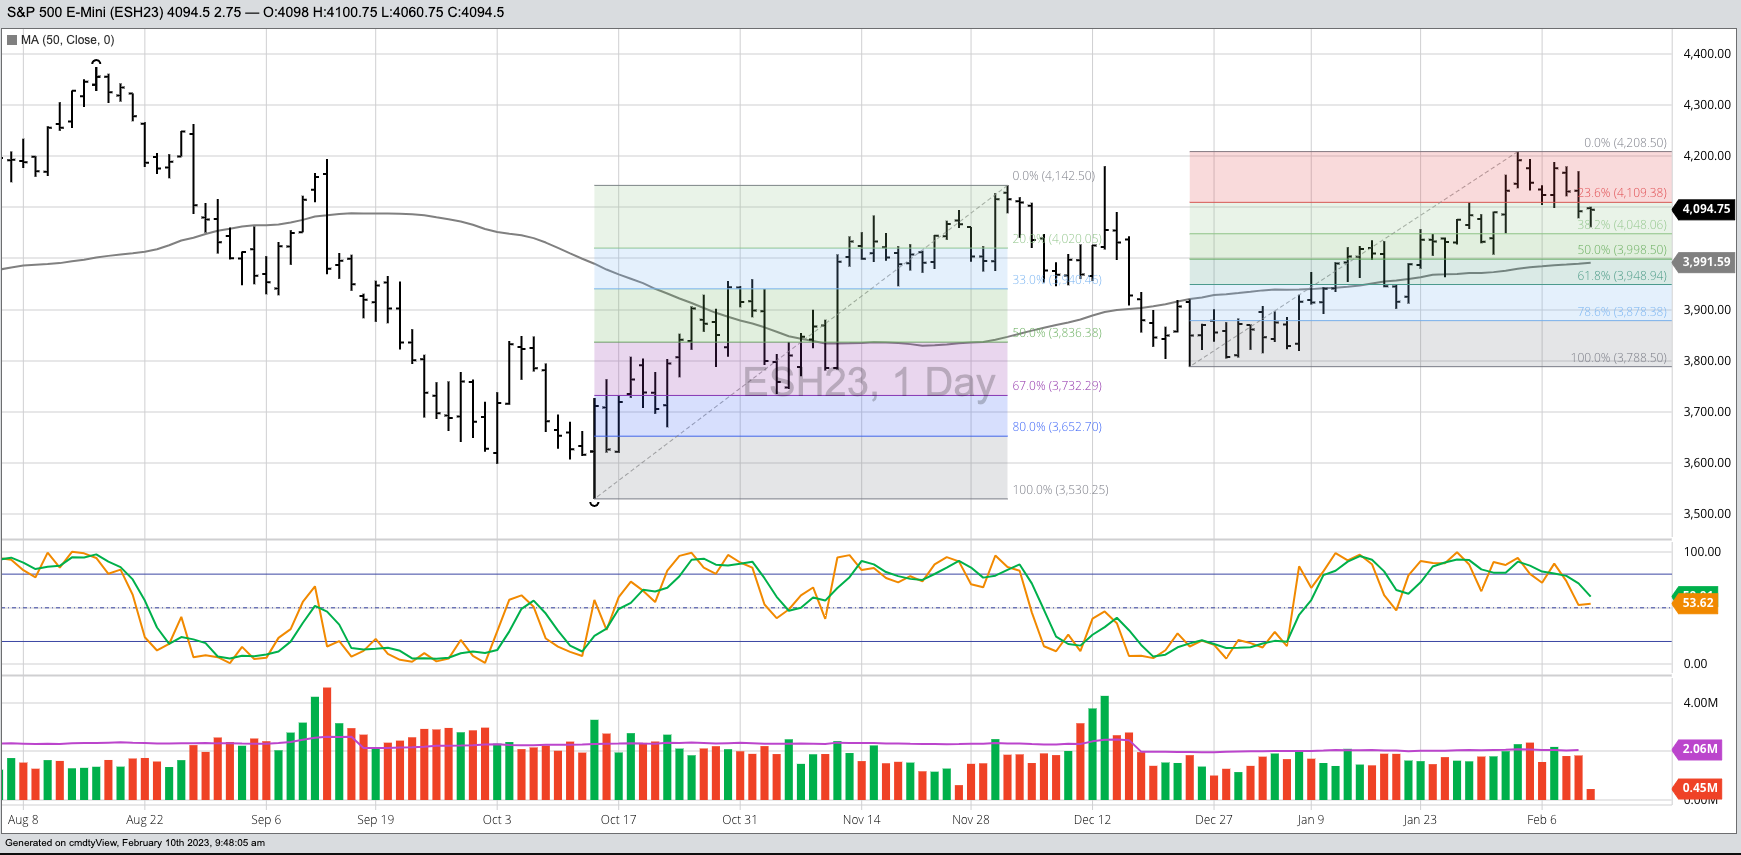
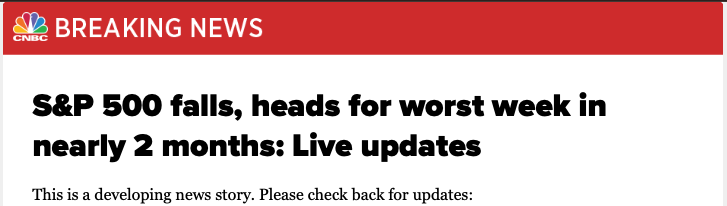
I was reminded of all this when a good friend asked me about Thursday’s breakdown in March S&P 500 futures (ESH23). From a technical point of view, the contract took out its previous 4-day[i] low of 4,078.25 and closed below that mark at 4,078.00. Based on the 4-Day Rule (a revision of the 4-Week Rule), this was further confirmation the contract’s short-term downtrend was strengthening. Lo and behold, the always exuberant CNBC.com sent out “Breaking News” this morning when the S&P 500 opened lower, projecting the index was headed “for worst week in nearly 2 months”.
Maybe, maybe not, for there is a long way to go in Friday’s session and US stock indexes. Two things we know for sure, anything important will happen in the session’s last half-hour (the NBA Rule) and all that matters is the close (the Wilhelmi Element). That means we have plenty of time to discuss the S&P, and any other market that comes to mind, before things actually get interesting.
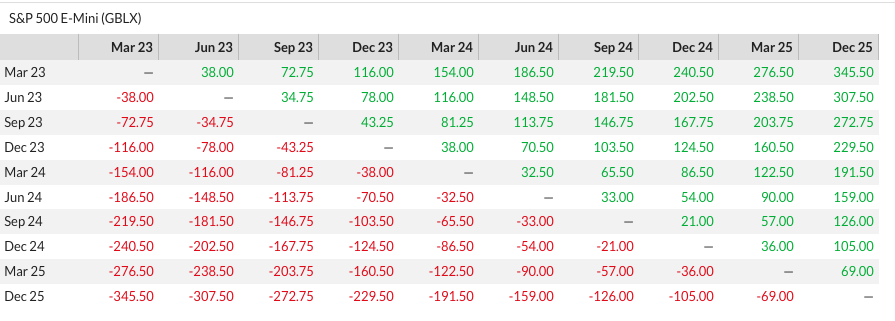
Yes, the futures market short-term trend looks to have turned down, but other than daytraders and foolish young brokers, who would trade the S&P 500 based on a daily chart? It’s a long-term investment market. In fact, my friend and I also discussed S&P futures spreads (naturally, I am me after all), with my read on the situation there is a normal carry due to the idea behind Newsom’s Market Rule 7: Stock markets go up over time. But, if the short-term trend wants to go down, and it certainly can, the daily chart for the futures market shows it tends to find support around its 50-day moving average.
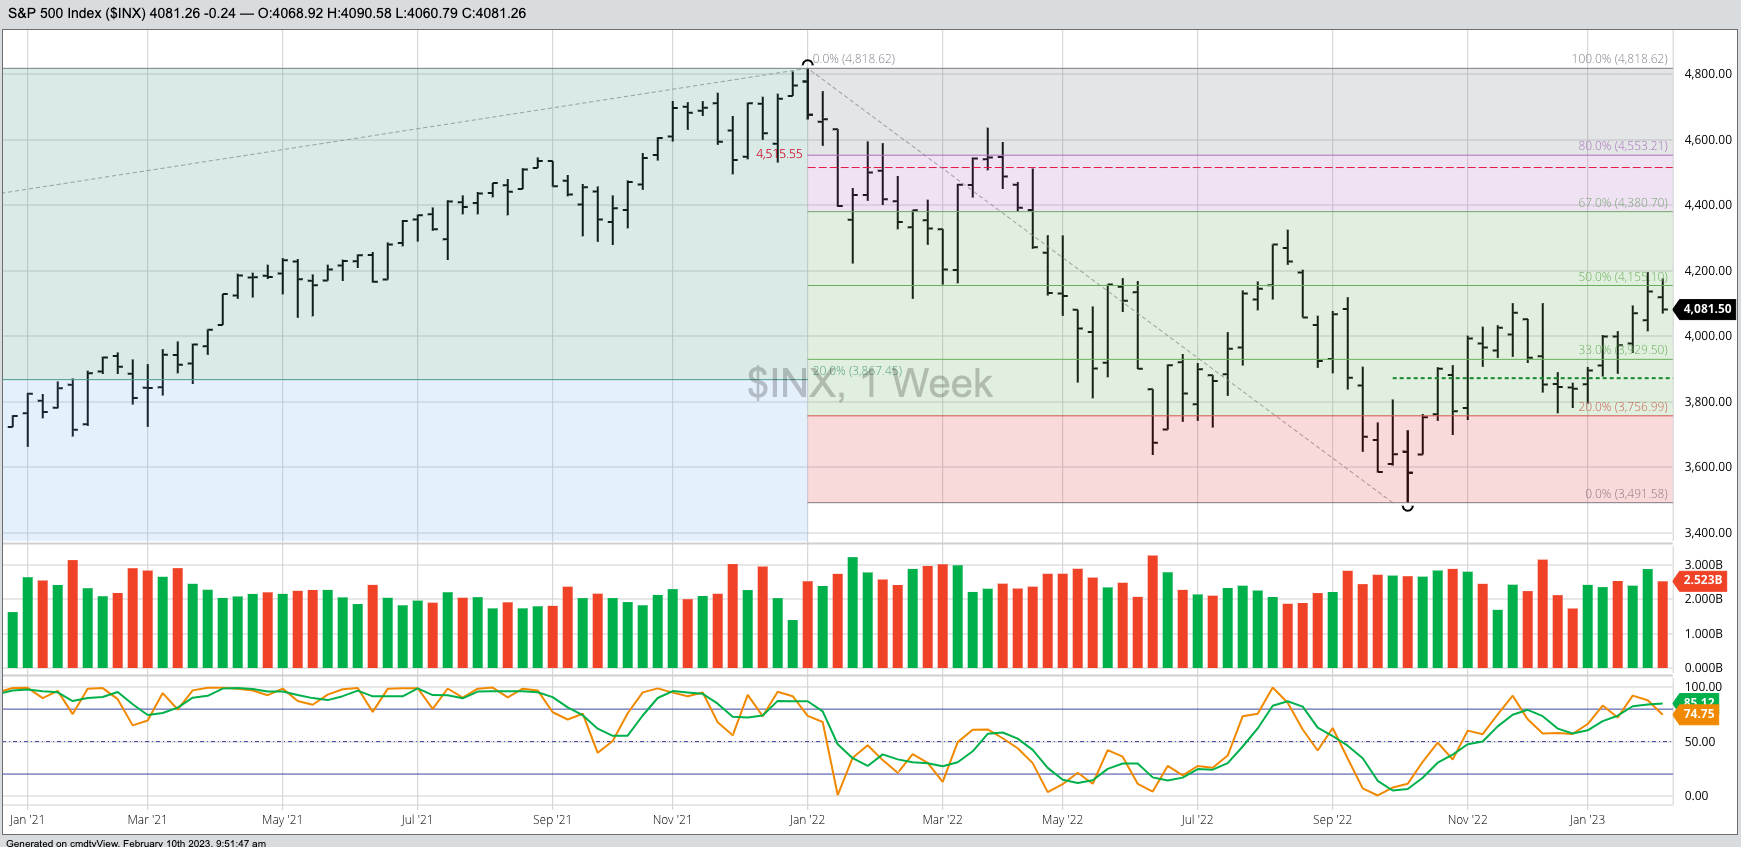
What about the intermediate-term trend on the index's ($INX) weekly chart, though? If we see a short-term downtrend, it would be viewed as Wave 4 of the 5-wave intermediate-term uptrend. A 50% retracement of Wave 3 puts a downside target near 3,980, with the 50-day moving average of the futures contract sitting near 3,991 Friday.
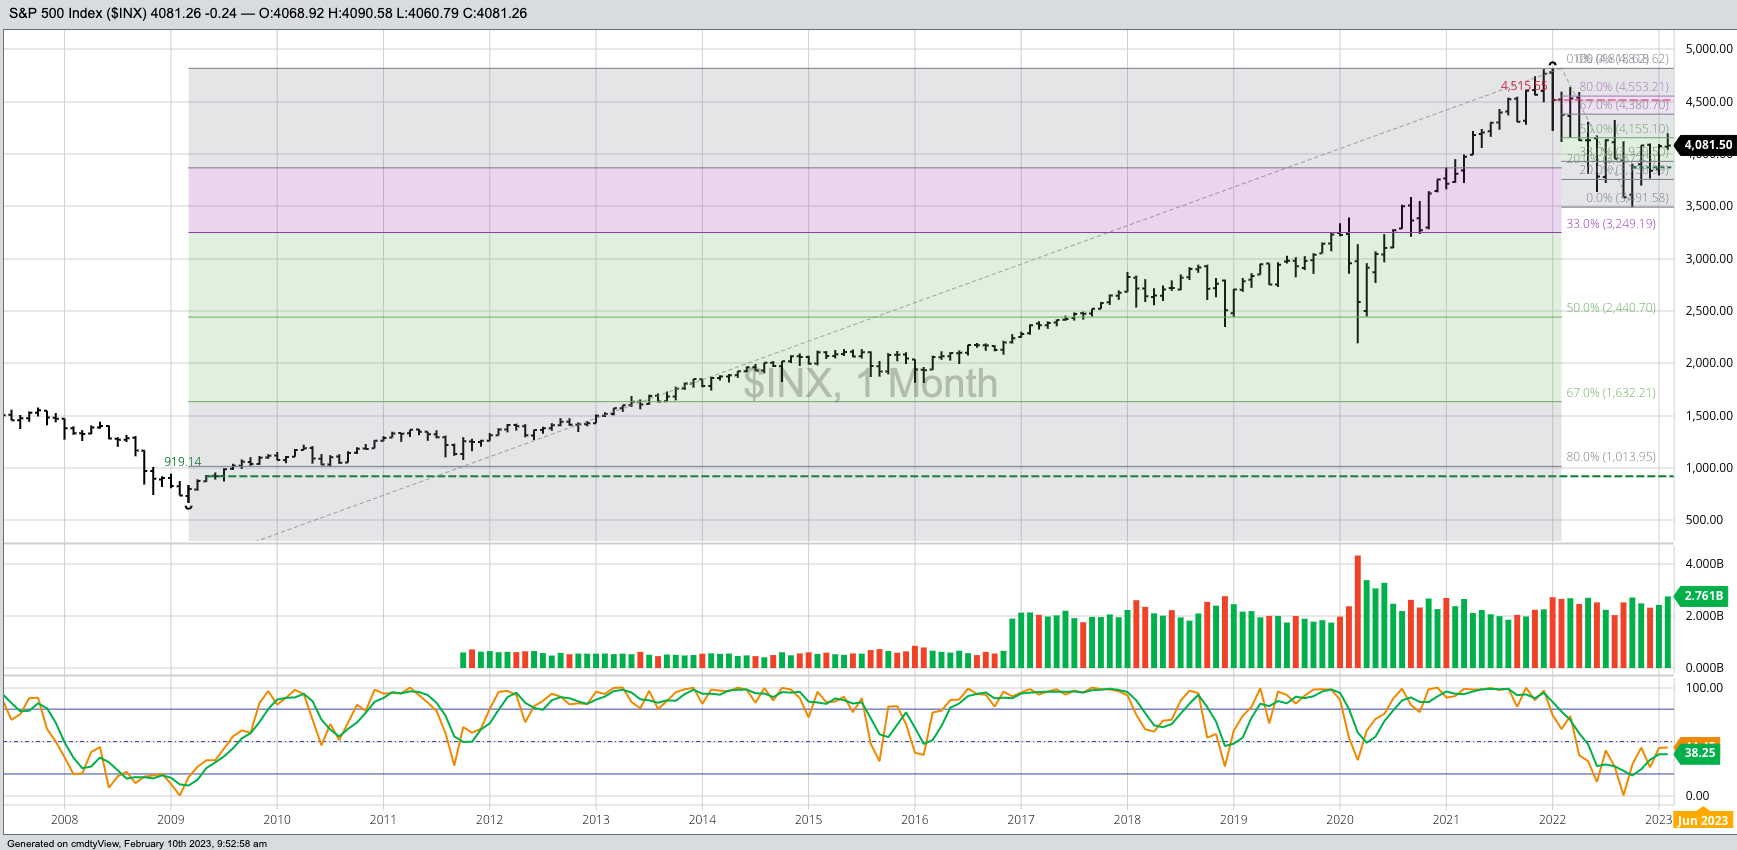
From an investor point of view, what does the long-term trend look like? As I’ve written about frequently, the long-term trend turned up last October as the index completed a bearish spike reversal on its monthly chart. This tells me we should see a 5-wave pattern develop over time, though often these waves are not clear on the monthly chart (e.g. the uptrend from March 2009 through the high of January 2022). Given this, it would not be surprising for the index to spend a few months going down.
I’ve read a number of market opinions stating the S&P 500 could lose 10% to 20% over the coming months. Okay. If that’s true and given the February high (so far) of 4,195, the downside target area would be between 3,775 and 3,355. With the October 2022 low at 3,491.58, and by definition Wave 2 can retrace about 80% of Wave 1, that puts a target near 3,633, in line with all the dire forecasts. What’s so bearish about a normal selloff wave within an uptrend?
Last January (2022), when the index completed its bearish key reversal, I talked of how long-term downtrends tend to last about 18 months. That put the bullish turn in the June 2023 timeframe. But markets do what they want, and we saw an earlier bullish reversal, though spike patterns often lead to some of the deepest retracements. It’s entirely possible that the S&P 500 spends the next few months pulling back a bit. If it does, though, we’ll have to be mindful of support at the previous 4-month lows. But that’s a discussion for another day.
[i] In his book Technical Analysis of the Futures Market, author John J. Murphy talks about the Four-Week Rule. The idea is a market is a buy when it takes out the previous 4-week high and a sell when it moves below the previous 4-week low. Based on my Goldilocks Principle (daily charts are too hot, monthly charts are too cold, but weekly charts are just right), most of my analysis looks at weekly charts and incorporates the 4-Week Rule. However, I also use it with short-term daily and long-term monthly charts when talking about those trends.
More Stock Market News from Barchart
- Apple's Earnings Missed, But Covered Call Options Are Still Popular
- Markets Today: Stock Indexes Slide as Bond Yields Climb on Hawkish Fed
- How To Increase The Yield On Bond Investments
- S&P Futures Slide As Rising Bond Yields Overshadow Earnings, Recession Fears Persist
On the date of publication, Darin Newsom did not have (either directly or indirectly) positions in any of the securities mentioned in this article. All information and data in this article is solely for informational purposes. For more information please view the Barchart Disclosure Policy here.

/An%20Intel%20sign%20out%20front%20of%20a%20corporate%20office%20by%20wolterke%20via%20Adobe%20Stock.jpeg)
/Alibaba%20by%20testing%20via%20Shutterstock.jpg)
/Alphabet%20(Google)%20Image%20by%20Markus%20Mainka%20via%20Shutterstock.jpg)