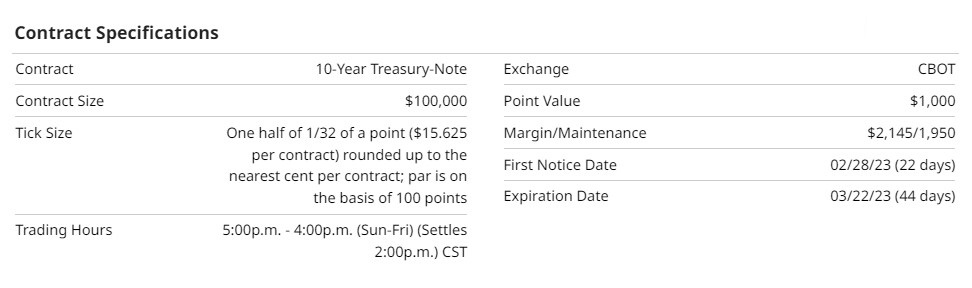
Specifications, Description, & Performance
US interest rates can be characterized in two main ways: by credit quality and maturity. Credit quality refers to the level of risk associated with a particular borrower. US Treasury securities, for example, carry the lowest risk. Maturity refers to the time the security matures and must be repaid. Treasury securities carry a full spectrum of maturities, from short-term cash management bills to T-bills (4 weeks, 3 months, 6 months), T-notes (2-year, 3-year, 5-year, 7-year, and 10-year), and 30-year T-bonds. The most active futures markets are the 10-year T-note futures, 30-year T-bond futures, and Eurodollar futures, all of which are traded at the CME Group.
Source: Barchart CRB Yearbook
The interest rate market struggles to get positive traction when the Federal Reserve (FED) remains hawkish on rates. Performance-wise, the 10-Year T-Note futures has appreciated approximately 3% during the past three months. In comparison, its 52-week performance was disappointing –at 2%.
Fundamentals
During the government-induced pandemic, the economy came to a halt. The FED was forced to reduce interest rates to near zero and began Quantitative Easing (QE), buying back longer-dated treasuries and mortgages to keep consumer rates low to stimulate the economy. As the country became addicted to this free money, employment and prices began a bull stampede that eventually led to an economic bubble, resulting in inflation, some would say "hyperinflation. This addiction was not just in the US. Global economies followed the US FEDs policies. Envision lemmings on a pier following the Pied Piper.
After missing every inflationary signal the market could give the FED, they continued to say that inflation was "transitory."
Eventually, the FED raised the Federal Funds Rate 8 times since March 2022. From .25% to the current rate of 4.75%. During this non-stop rate increase, the FED has not paused, allowing the markets to digest these significant changes. Simultaneously, the FED began a Quantitative Tightening (QT) of selling the holdings from the earlier QE. The concern now becomes this expansive rate increase, and liquidity-draining QT sets the economy up for a recession. There have been recent signals from the economy that some sectors are slowing, but the nemesis remains the "exuberant" employment situation. What would Allan Greenspan do now?
Seasonal Pattern

Source: Moore Research Center, Inc. (MRCI)
MRCI research illustrates how the March 10-year T-Note Futures typically peaked around February in the past 15 and 30 years. A portion of this can be attributed to the March futures FND on February 28. Price has been in a consistent uptrend off the October lows. As traders approach FND, all longs in the March contract must liquidate their positions regardless of whether to roll over or take profits. Ten-year futures contracts are physically delivered.
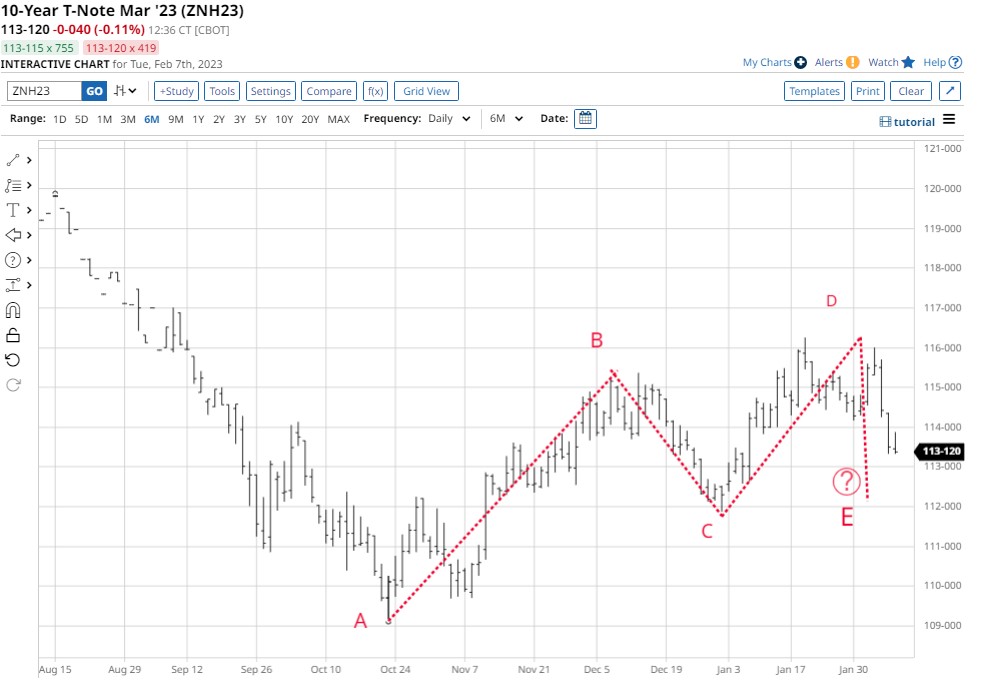
Since finding a low seasonal price in late October (A), prices have followed their seasonal tendencies well. The peak in December (B) illustrated prices declining to the end-of-year seasonal low (C) and then rallying up into the Seasonal peak in February (D). MRCI research demonstrates a price decline from (D). An Important point, when interest rate futures prices fall, the yield goes up. When the futures price rallies, the yields go down.
Technical View

Many traders only use a futures chart for their technical analysis. I'm using a yield chart instead of a price chart for the 10-year Treasury market ($TNX) in the chart above. It's inverse to a price chart because the scale on the right side is measured in an interest rate, not price, as a futures chart would.
MRCIs research is currently looking for a peak in the futures price, but on a yield chart, we would be looking for a low.
I've identified some potential targets at a higher yield using broken support that is now resistance.
The market currently returned to some old resistance that is now support from the June yield highs.
Now let's explain why a futures price chart is only sometimes the correct source.
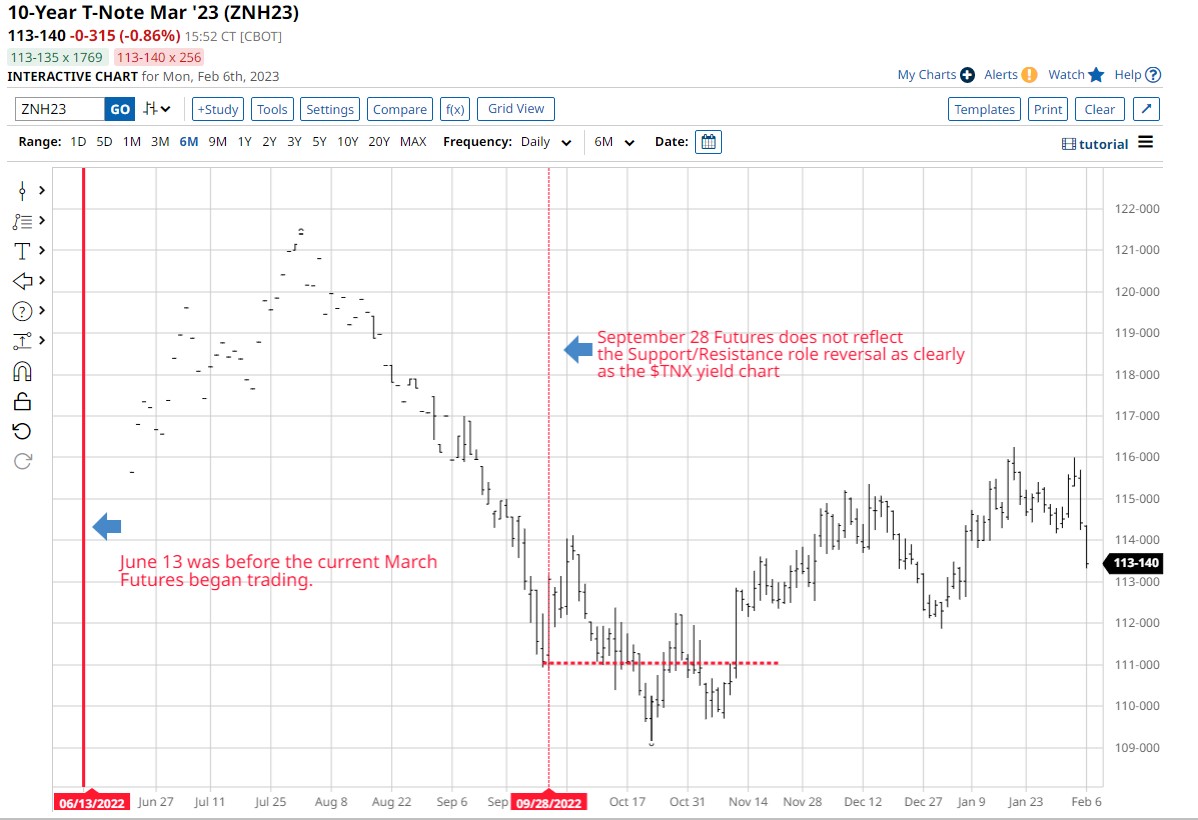
All futures contracts expire, meaning they have a life from the First Trading Day (FTD) to the Last Trading Day (LTD). Futures contracts can have multiple months trading simultaneously, but there is only one of the months with the most liquidity, and that one is called the "Front Month." A contract is only a front month for approximately the last three months of its trading life. Before that, it was highly illiquid, as the chart above shows on the left side.
The most accurate price chart when trading futures is contract specific. Chart packages offer continuous charts to eliminate the illiquid portion of a chart, but they could be more accurate.
The June 13 date on the futures price chart illustrates the lack of required information to make a trading decision. Looking back at the yield chart on the same date, we find clarity in price bars with prestigious chart quality.
This clarity is because the yield plotted on the chart never expires like a futures contract. The yield chart is similar to a stock or Exchange-Traded Fund (ETF) that continuously trades without expirations, rollovers, etc.
Summary
Exploring other venues to find consistent and accurate data is a significant advantage for traders or investors. Due to how futures contracts are constructed, we must be flexible in our analysis styles.
All futures contracts are a derivative of a particular cash market. And both futures and cash products are typically highly correlated. Due to these facts, the yield chart reflects where the Government's cash 10-year Treasury Note yields are trading. Compared to the 10-year Treasury Note futures contract, that is the derivative of the cash yield.
With the approaching FND of the March T-Note futures and MRCIs research showing a peak in price (trough in yield) for February, there is a possibility of seeing another run at the 10-yield of approximately 4%.
In a recent article for Barchart, "The Short End of the Yield Curve is Due for Higher Rates," I discuss how short-term treasury yields seasonally peak around February in preparation for the upcoming income tax refund season. Comparatively, the 10-year T-Note is due to do the same.
More Interest Rate News from Barchart
- Stocks Mixed as Markets Brace for Fed Chair Powell’s Comments
- Stocks Lower on the Outlook for Hawkish Fed
- More Earnings On Tap, Powell Speaks And Other Key Themes To Watch This Week
- Stocks Tumble as a Robust U.S. Labor Market Keeps Aggressive Fed in Play
On the date of publication, Don Dawson did not have (either directly or indirectly) positions in any of the securities mentioned in this article. All information and data in this article is solely for informational purposes. For more information please view the Barchart Disclosure Policy here.
/Micron%20Technology%20Inc_%20logo%20on%20building-by%20vzphotos%20vis%20iStock.jpg)


