/Apple%20Inc%20logo%20on%20Apple%20store-by%20PhillDanze%20via%20iStock.jpg)
Apple Inc (AAPL) reported strong fiscal Q2 free cash flow growth (+28% YoY) and high FCF margins driven by iPhone sales and services growth. As a result, AAPL stock could still be over 23% undervalued based on our FCF margin and FCF yield model.
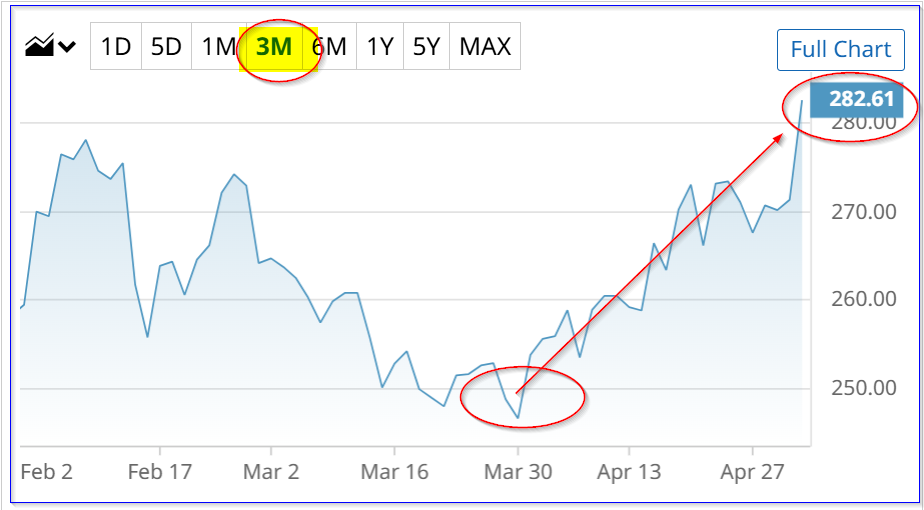
AAPL is up over 4% to $284.25 per share, and could have more upside. My model shows AAPL could be worth over $350 over the next 12 months. This article will show why.
Strong FCF Growth, Margins, and Buybacks
Apple's fiscal Q2 iPhone sales rose 22% YoY, and its services revenue was up 16.3%. That drove strong profits, with net income up +19.4%, and earnings per share (EPS) up +21.8% from $1.65 to $201.
Note that EPS rose faster than net income due to Apple's continuing strong share buyback program. That is because Apple spends almost 2/3rds of its free cash flow (FCF) on buybacks, i.e., 65.2% over the trailing 12 months (TTM) based on Stock Analysis data:
$84.2 billion share repurchases TTM / $129.174 billion TTM FCF
Management indicated on the conference call that it will no longer focus on reducing its net cash balance through share buybacks. It intends to focus on investing in its business first and then consider buybacks. That could signal a move by the company to spend more on AI-related investments.
Nevertheless, its board still authorized a new $100 billion share buyback program.
All of this is possible due to its strong free cash flow (FCF) and FCF margins. I discussed this in my last Barchart article, April 20, “Apple Has Unusual Put Options Activity - Has AAPL Stock Peaked Ahead of Earnings?”
I suggested that if the company can maintain its FCF margins (i.e., FCF / revenue), AAPL stock could be undervalued. As it turned out, its Q2 FCF margin was 24.0% vs. 21.9% last year, based on Stock Analysis data.
Moreover, over the last year, its $129.174 billion in FCF represented 28.61% of its TTM revenue ($451.44 billion). That compares to 28.31% last quarter and 24.6% in last year's TTM margin.
In other words, its FCF margins are rising, even after revenue grows. That implies that over the next 12 months (NTM) Apple's FCF could rise significantly and the stock could be undervalued.
Valuing Apple Stock Based on Its FCF
For example, based on analysts' revenue forecasts over the next two years, its next 12-month (NTM) revenue will average exceed $490 billion:
Yr ending Sept 2026 ……. $472.48 billion revenue est (Seeking Alpha)
Yr ending Sept 2027 ……. $508.37 billion revenue est
Avg next 12 months ……… $490.425 billion NTM revenue est
So, assuming Apple can continue to make a 28.6% FCF margin over this period, FCF could generate over $140 billion in FCF:
$490.425 b x 0.286 = $140.26 billion FCF
As a result, if the market were to value this using a 2.5% FCF yield, the stock could be worth over $5.6 trillion:
$140.26 b / 0.025 = $5,610 billion
That is +34.8% over its present market cap of $4,162 billion, according to Yahoo! Finance today. But, just to be conservative, let's say the market uses a lower metric, a 3.0% FCF yield:
$140.26 b / 0.03 = $4,675.3 billion, i.e., +12.3% over today's market value.
Therefore, the valuation range is between 12.3% and 34.8% higher. So, on average, AAPL stock could be worth 23.55% more:
1.2355 x $284.25 = $351.19 per share target price
Analysts Agree AAPL is Cheap
Analysts have been raising their price targets. For example, Yahoo! Finance reports that the average target price (TP) from 48 analysts is almost $300 (i.e., $298.46).
That's up from a week ago, as I reported in my April 20 Barchart article, when the average was $297.46.
Similarly, Barchart's mean analyst survey TP is now $296.59, up from last week. AnaChart's survey of 28 analysts is now $305.82, up from $294.50.
The bottom line is the AAPL stock still looks cheap here, despite today's gains. This is based on its strong FCF margins and analysts' price targets.
However, there is no guarantee AAPL will keep rising. One way to set a lower buy-in price and get paid is to short out-of-the-money (OTM) puts.
Shorting OTM AAPL Puts
For example, the Barchart option page for June 5, a little over a month from now, shows that the $270 put strike price has a midpoint premium of $2.80. That strike price is 5% below today's price (i.e., “out-of-the-money”).
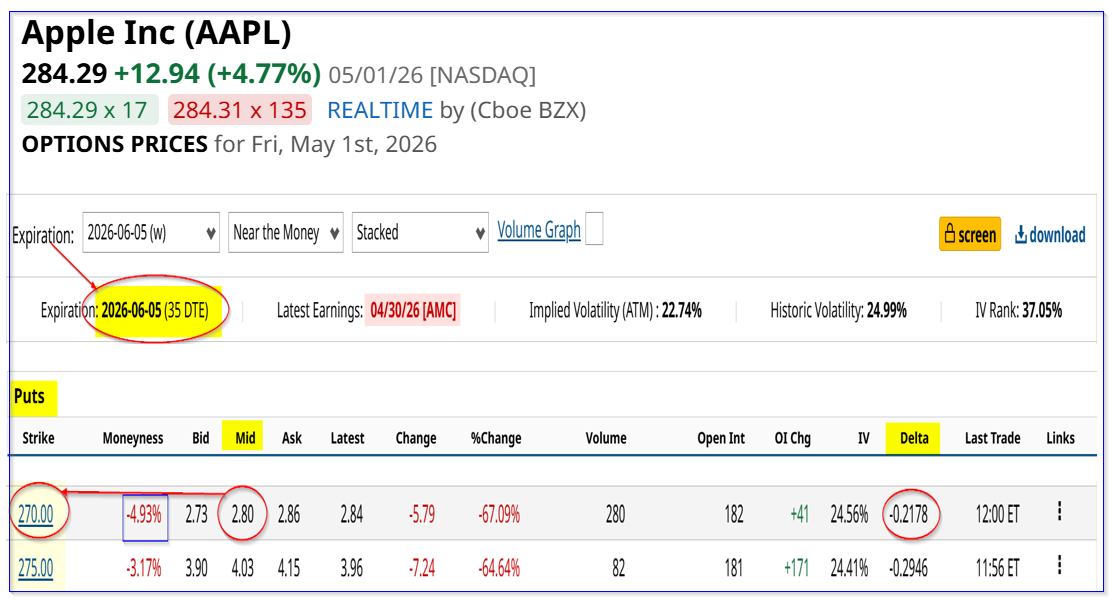
That premium represents a 1.03% short-put yield for a short-seller. For example, after securing $27,000 with their brokerage firm, an investor can receive $280 after entering an order to “Sell to Open” 1 put contract at $270.
That also lowers the potential buy-in breakeven point to $270 - $2.80, or $267.20. That's 6.0% below today's price and provides an attractive way to set a lower buy-in.
Less risk-averse investors can short the $275.00 put strike price contract and receive a 1.1465% yield (i.e., $403 income/$27,500 per put contract).
Moreover, some investors can use this income to help pay for long-term in-the-money (ITM) call options. I will write more on this in an upcoming Barchart article.
On the date of publication, Mark R. Hake, CFA did not have (either directly or indirectly) positions in any of the securities mentioned in this article. All information and data in this article is solely for informational purposes. For more information please view the Barchart Disclosure Policy here.

/Nvidia%20logo%20by%20Konstantin%20Savusia%20via%20Shutterstock.jpg)
/Apple%20products%20on%20desk%20by%20Ake%20Ngiamsanguan%20via%20iStock.jpg)

/Microsoft%20headquarters%20By%20Peter.jpeg)